Understanding your analytics figures
What every card and chart on the Analytics page counts, from gross sales and average order value to sales channels and fulfilment.
The Analytics page shows your store as a set of cards and charts. This guide explains what each one counts, in the order they appear on the page. Open it from Analytics under Insights in the left-hand menu.
Considerations
- Draft orders, cancelled orders and refunded orders are left out of every figure on the page.
- Money figures are shown as a currency code and a rounded number, such as GBP 34.9K. That means about 34,900 pounds. Chart axes use the currency symbol instead.
- Sessions and conversion figures come from store tracking, not from your order records, so they will not match your order counts exactly.
The four summary cards
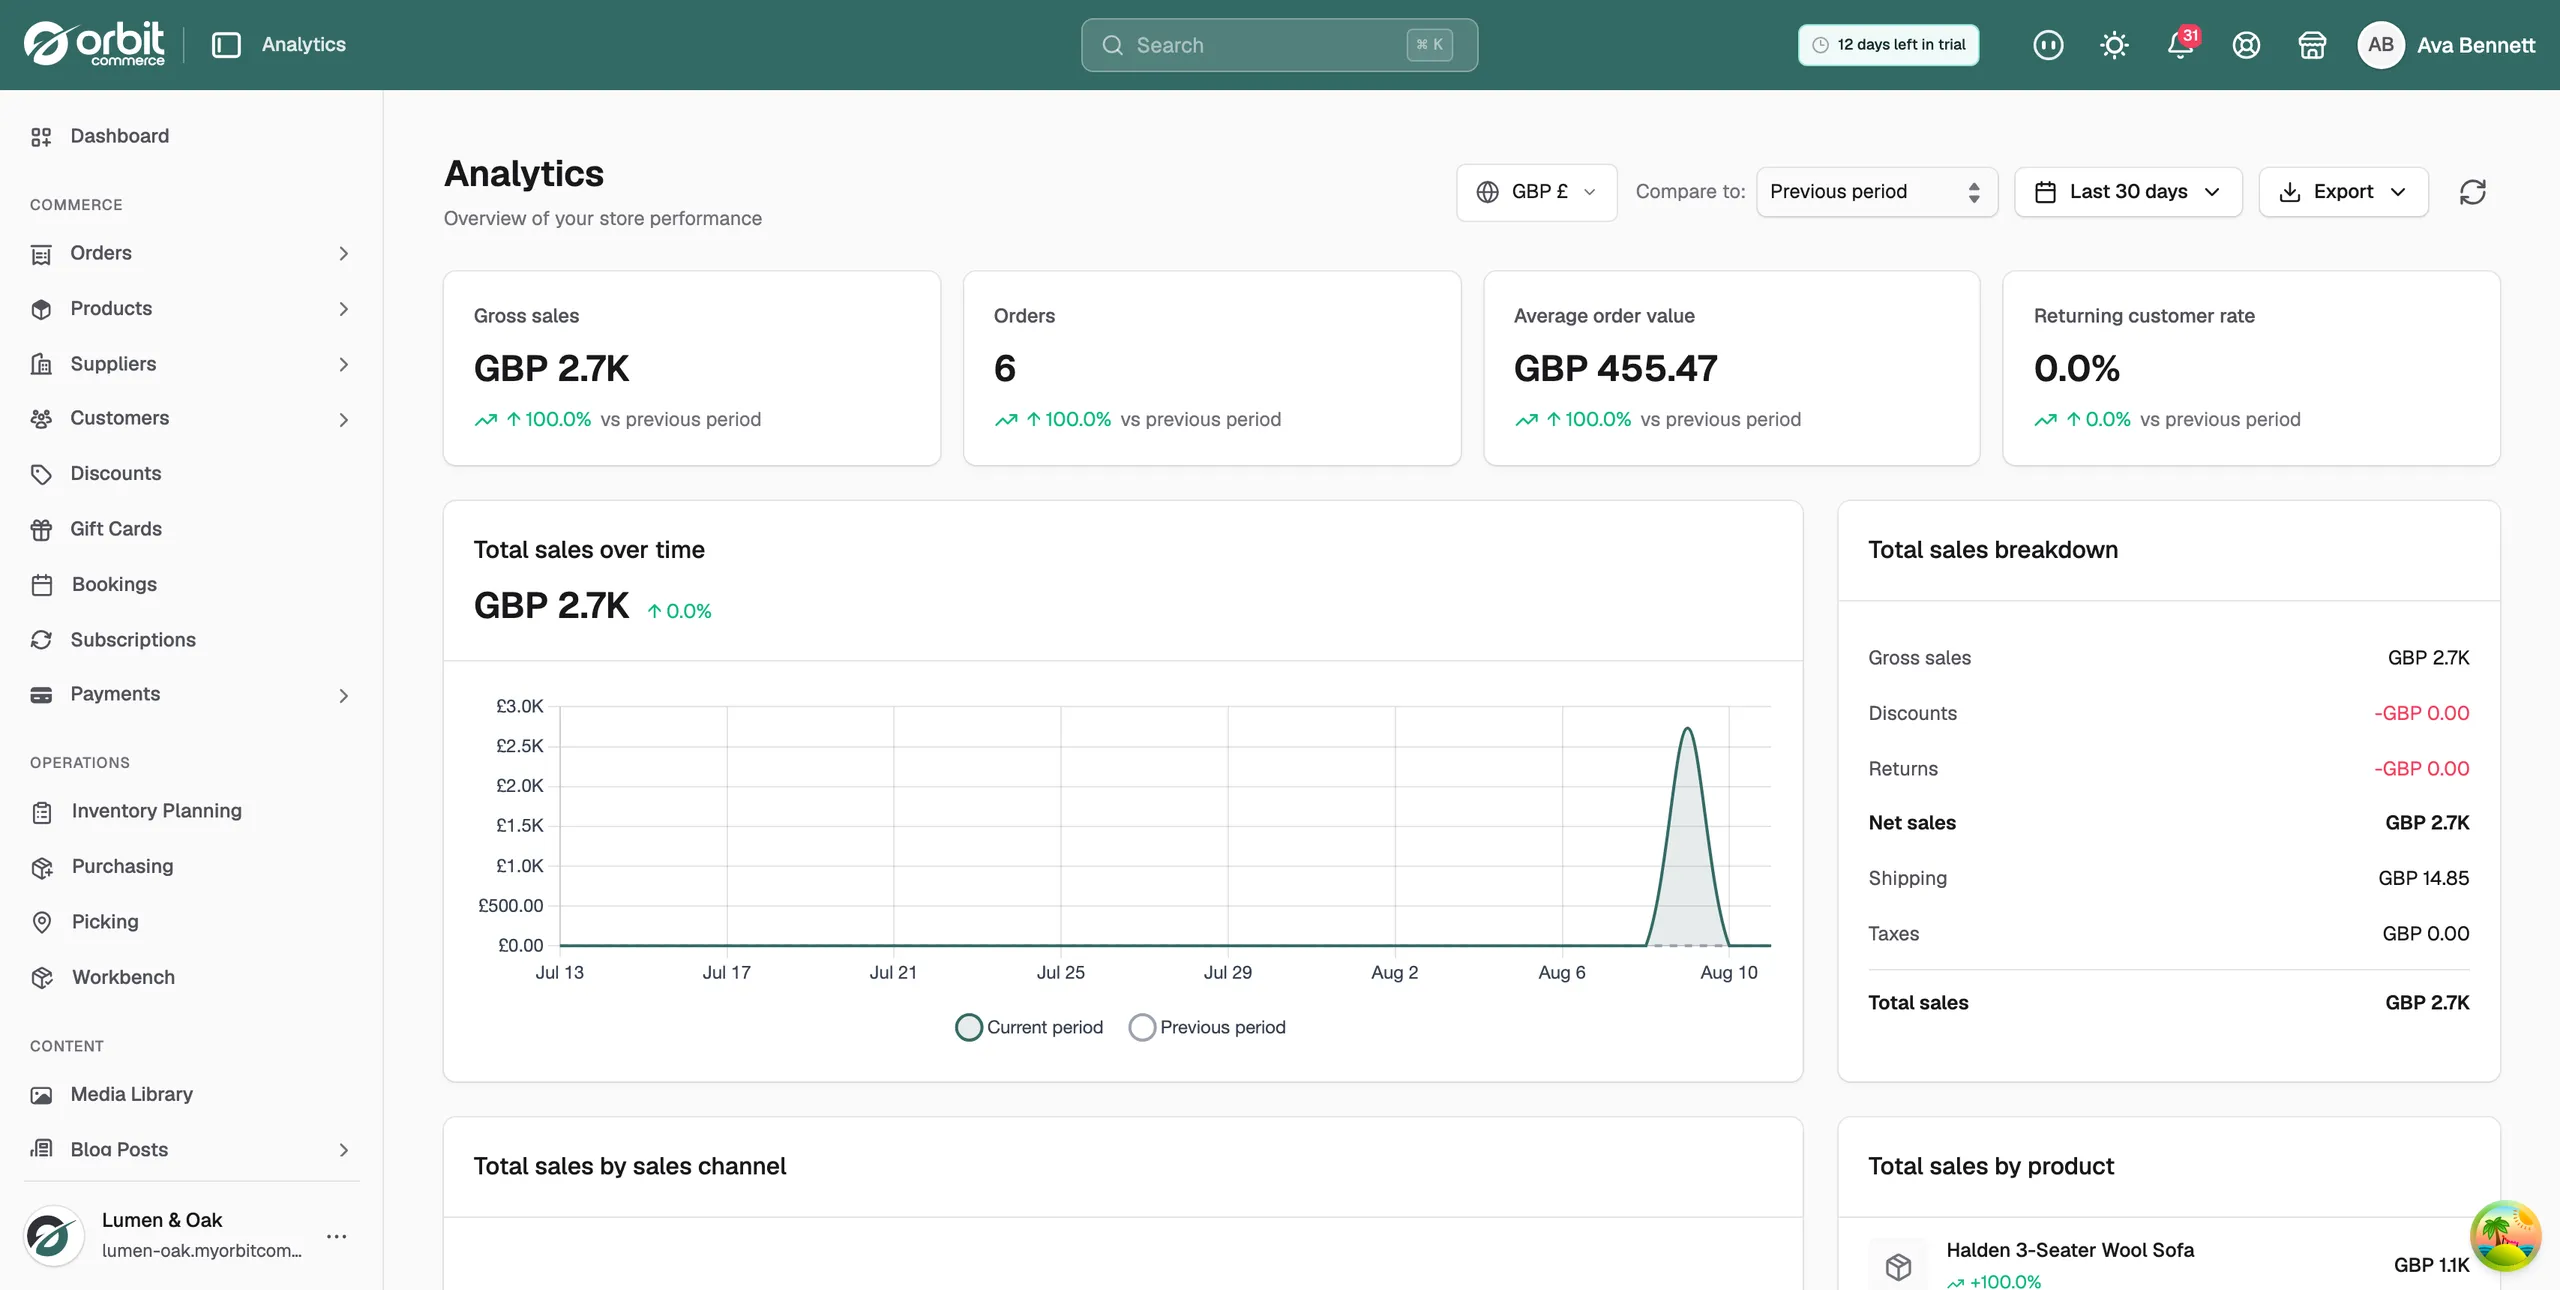
- Gross sales: the value of paid orders placed in the period. Order totals include delivery and tax and are after discounts.
- Orders: how many orders were placed in the period. Orders still waiting for payment are counted.
- Average order value: gross sales divided by the number of paid orders.
- Returning customer rate: of the customers who ordered in the period, the share who had also ordered before it started. Guest orders are not counted.
Each card carries an up or down arrow, a percentage and the words vs previous period. Green is up, red is down.
Total sales over time and Total sales breakdown
Total sales over time plots your sales day by day. The solid line is the period you picked. The dashed grey line is the period you are comparing against.
Total sales breakdown lists seven lines:
- Gross sales: the value of paid orders placed in the period.
- Discounts: the discount taken off those orders.
- Returns: the money you refunded in the period.
- Net sales: gross sales after discounts and returns.
- Shipping: delivery charged on those orders.
- Taxes: tax charged on those orders.
- Total sales: the figure at the foot of the card.
Where your sales came from
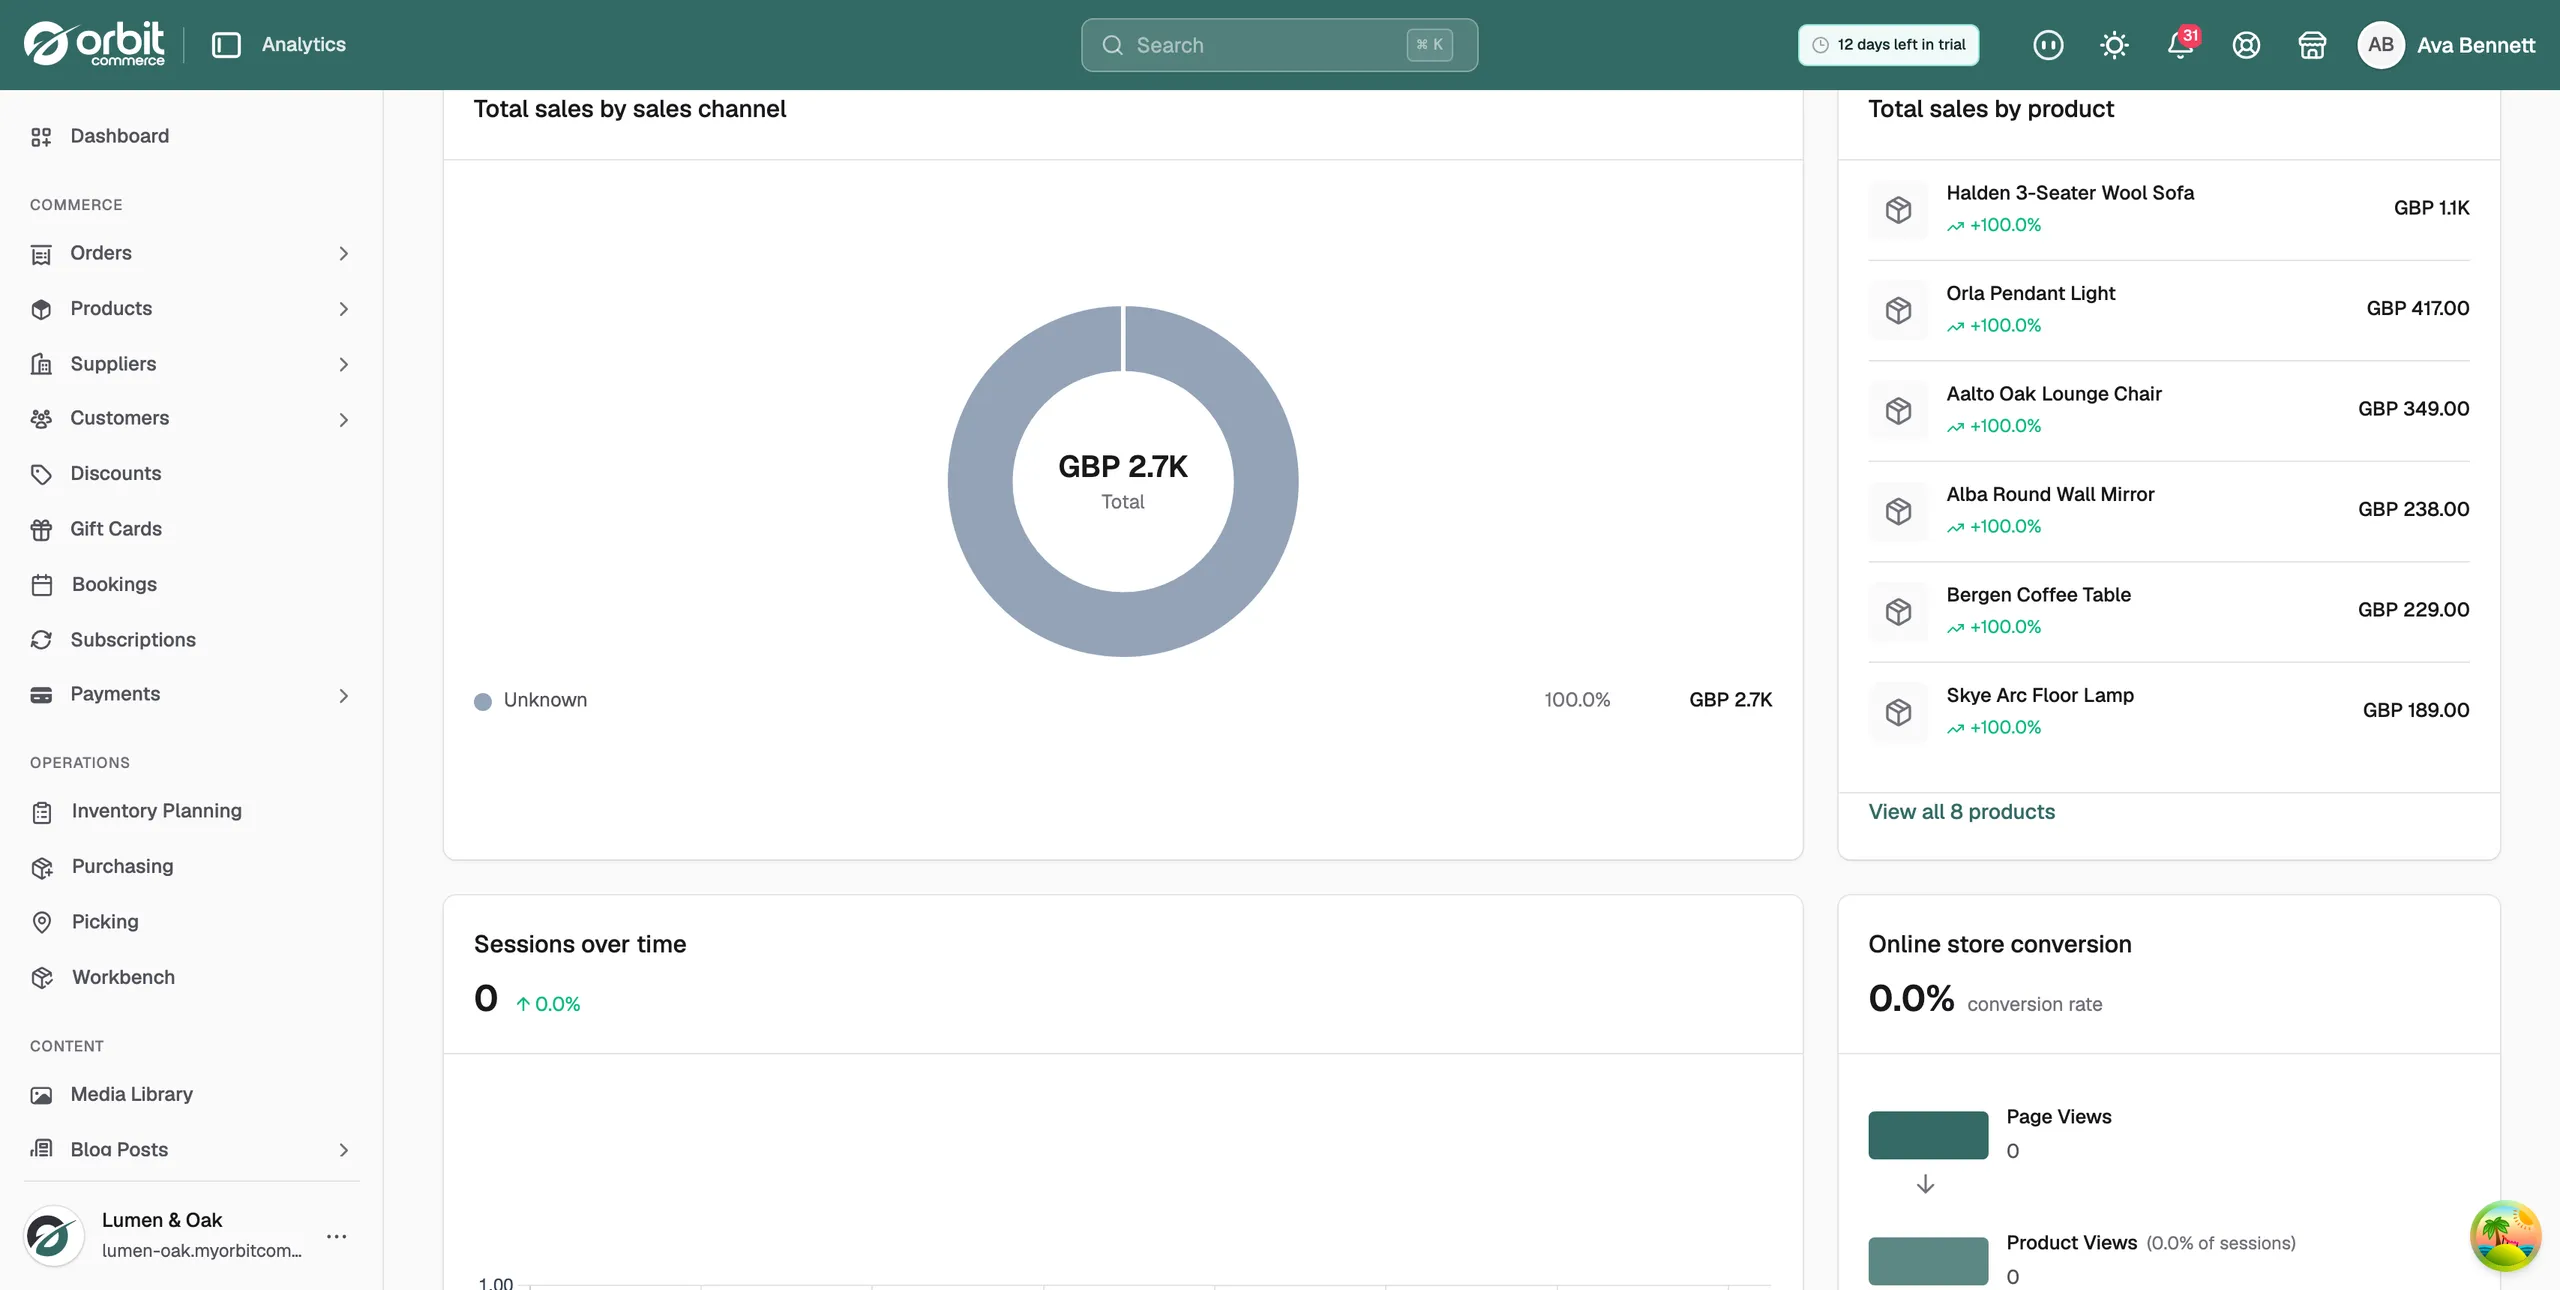
Total sales by sales channel is a ring chart with the total in the middle and a row for each channel showing its share and value. Sales land under how the customer first found you, not how they came back. Channels are Direct, Organic, Social, Email, Referral, Paid, AI assistants and Unknown. Orders with no tracking data land under Unknown.
Total sales by product lists your best sellers, biggest earner first, with the change against the period before. Where you have more than six, a View all line appears at the foot of the card.
Traffic and conversion
- Sessions over time: visits to your store, day by day, with the period before dashed underneath. One person visiting twice counts twice.
- Online store conversion: how far visitors got before buying, step by step. See Reading the conversion funnel.
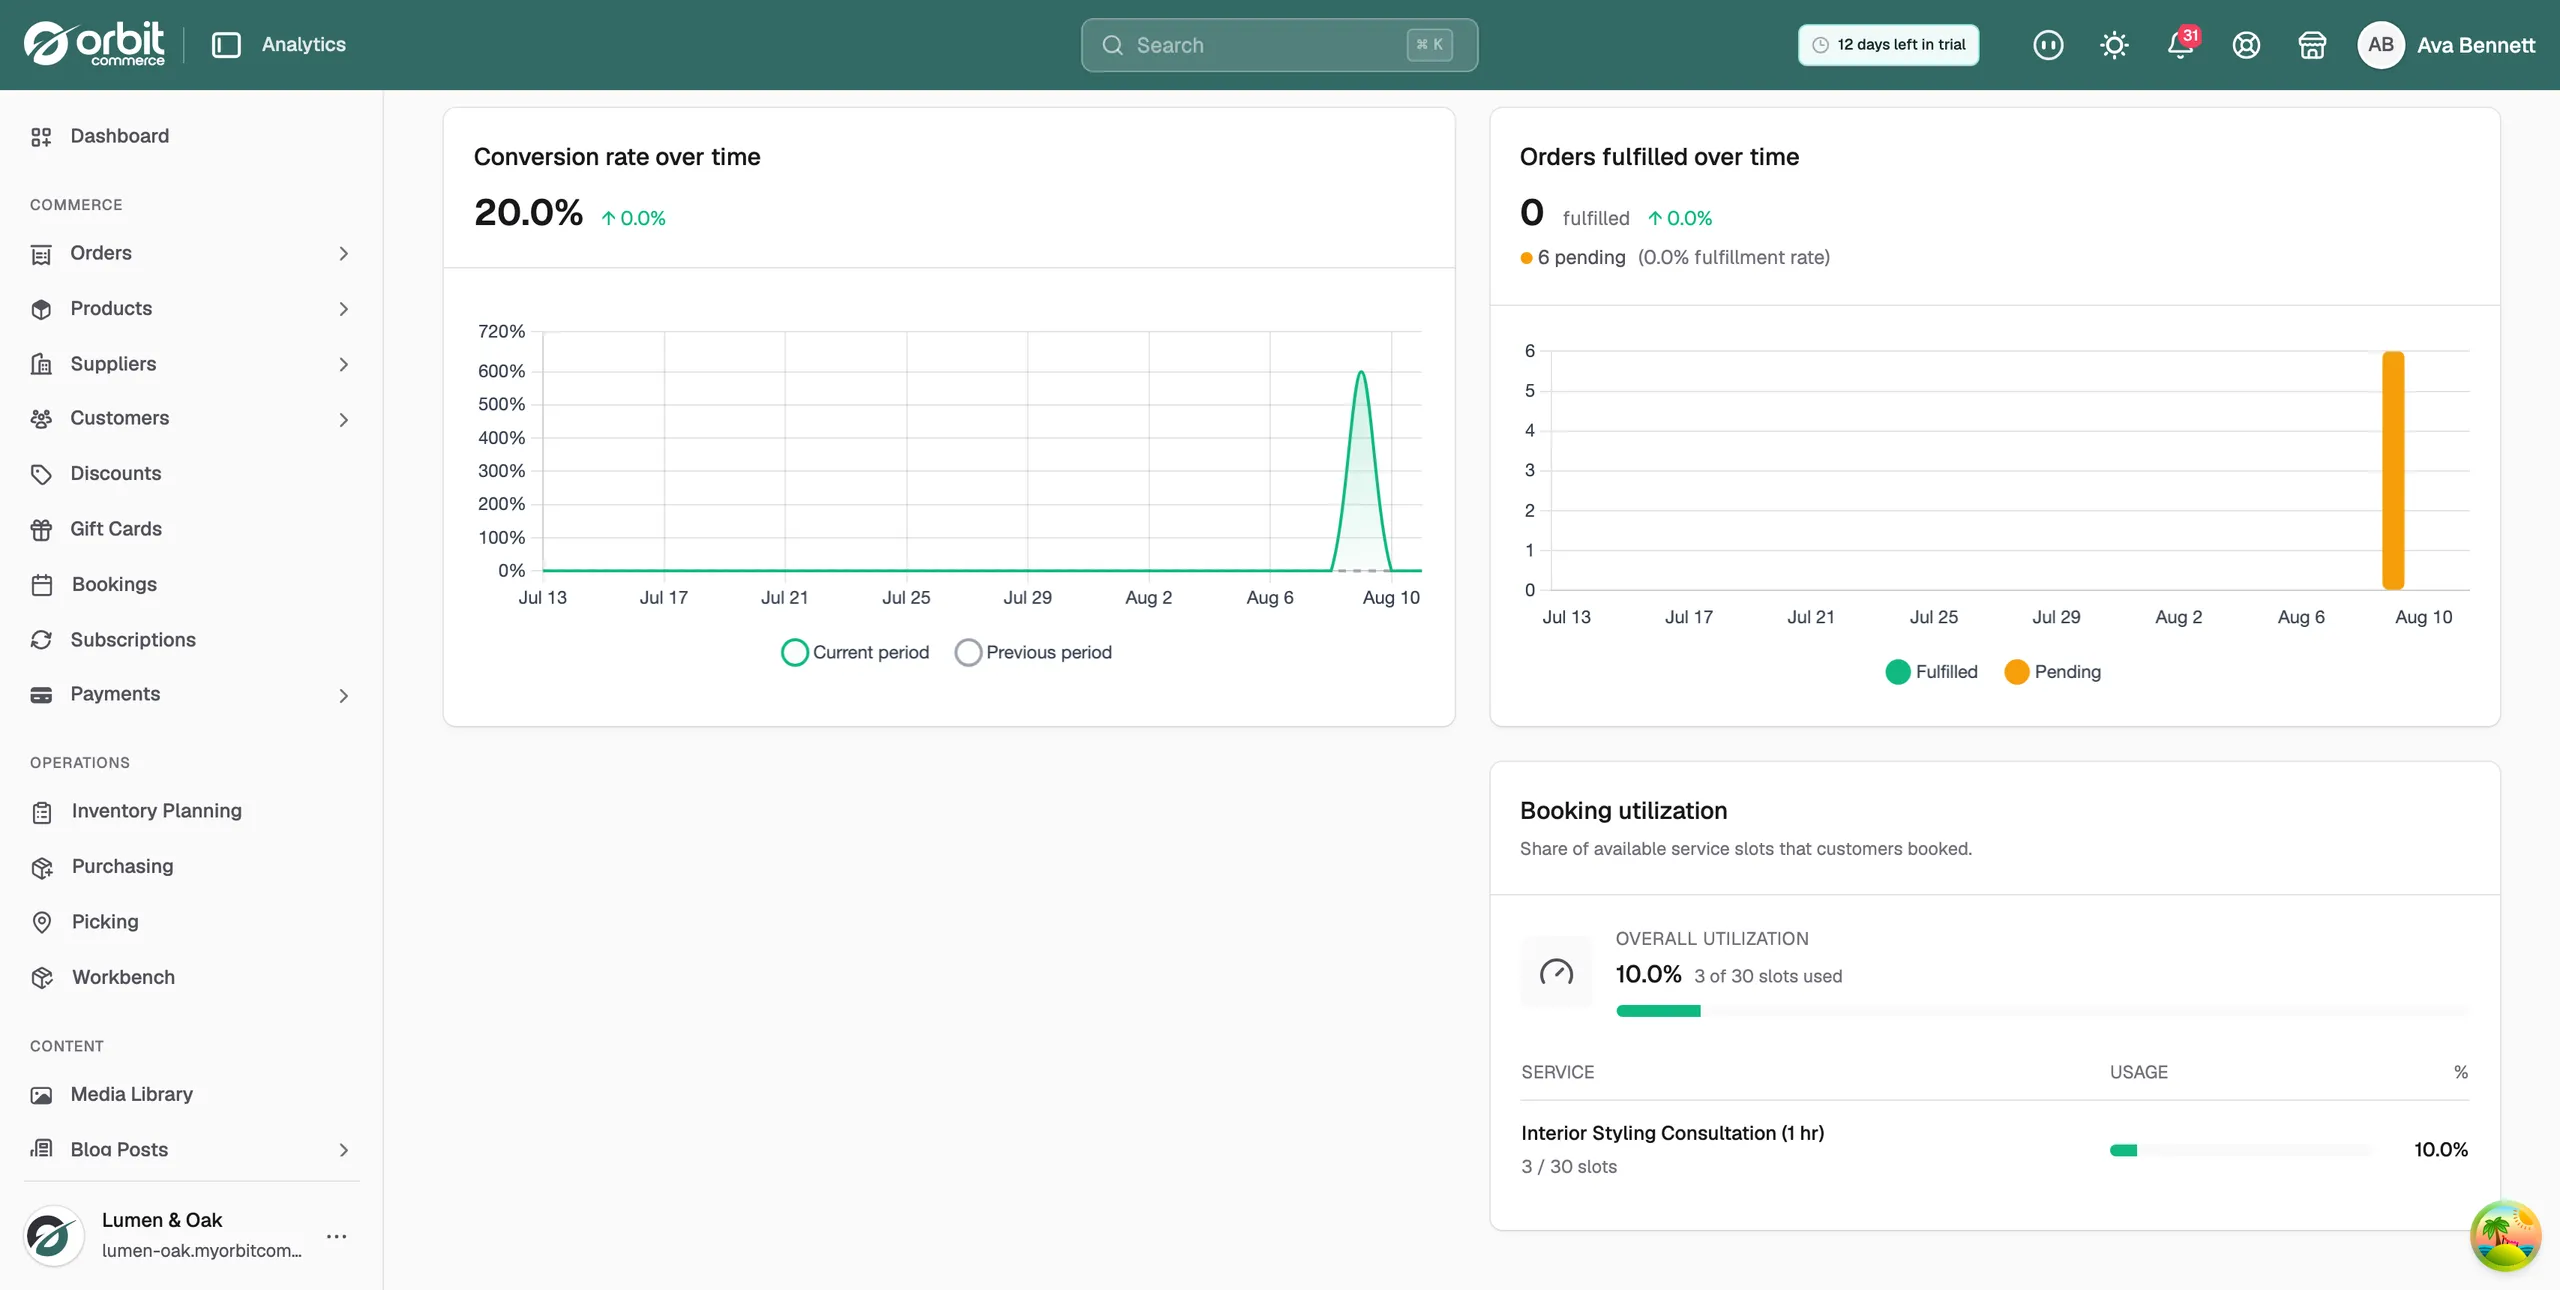
- Conversion rate over time: the share of visits that ended in a purchase, across the period.
Orders fulfilled over time
A stacked bar chart of orders you have sent out. Fulfilled is green and Pending is amber. Above the chart you get the number fulfilled, the number still pending, and the fulfilment rate as a percentage. Pending is the bar to act on.
Change what the figures cover
- Currency: the currency your money figures are shown in.
- Compare to:: Previous period, Previous year or No comparison.
- The date button: Last 30 days until you change it.
- Export: download the page as CSV, Excel or PDF.
- The refresh icon: load the latest figures.
Tip: Read a number with its comparison, not on its own. A large percentage against a very small base is noise. Check the absolute figures beside it.
Related guides
Was this helpful?
0 people found this helpful