Reading the conversion funnel
Use the Online store conversion card to find the step where your store loses shoppers, and what to change at each one.
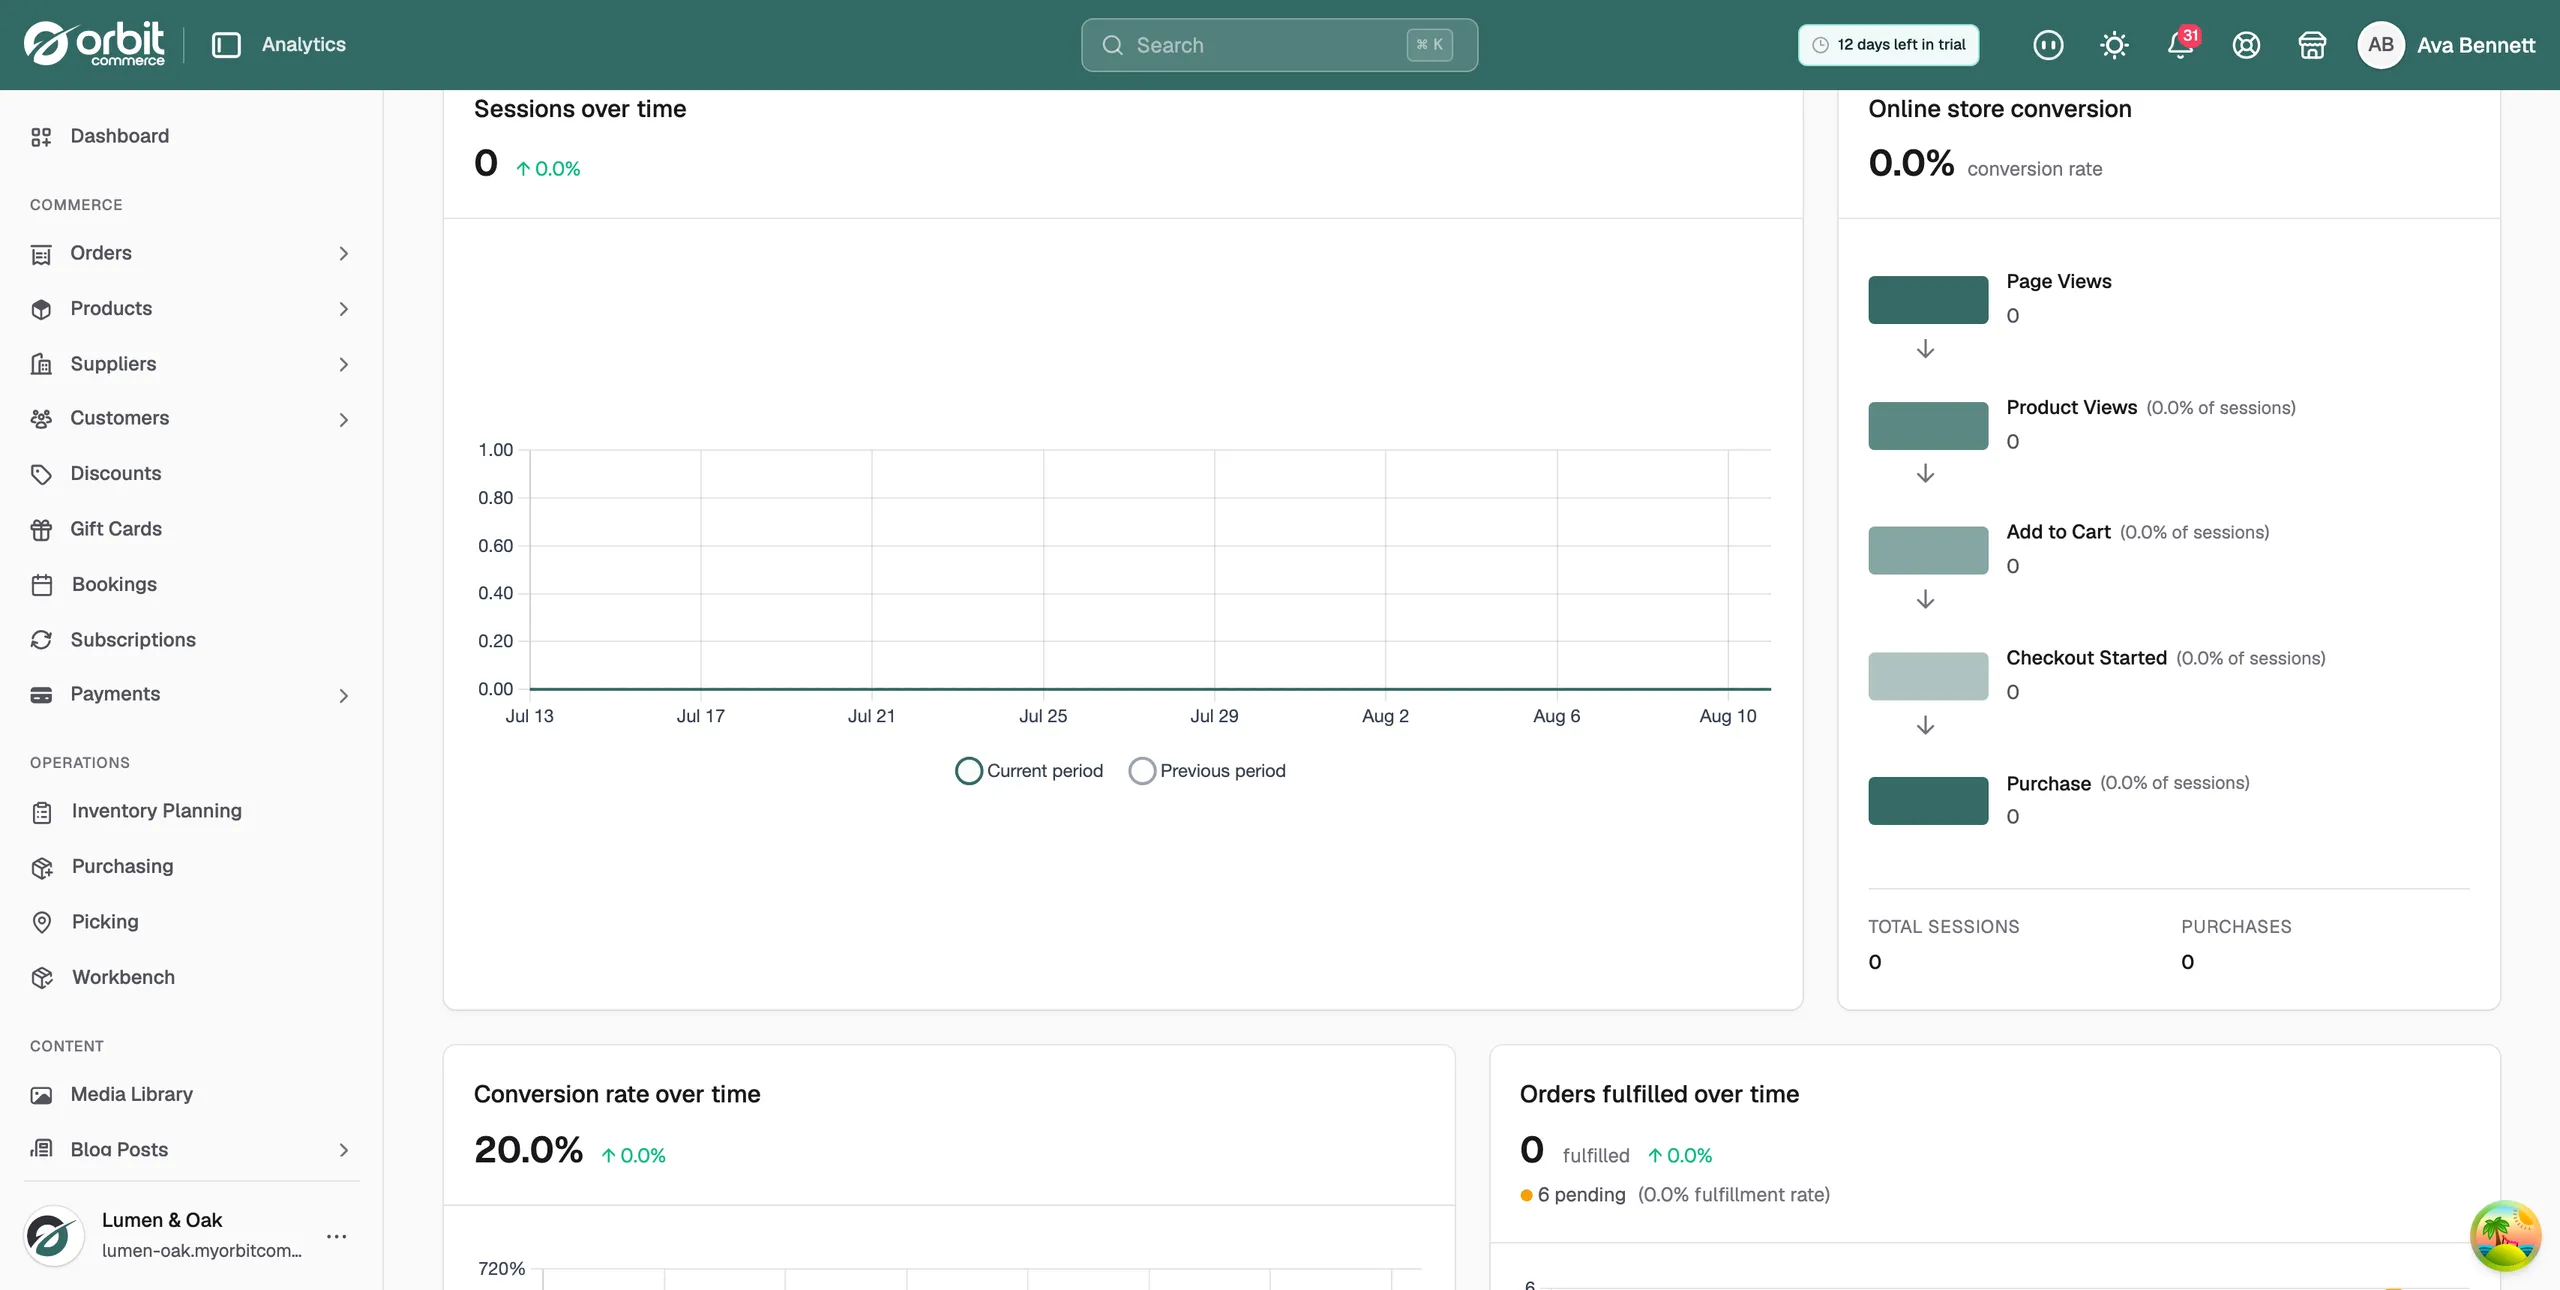
Every sale follows the same path. Someone lands on your store, looks at a product, adds it to their cart, starts checkout and pays. Shoppers fall away at each step. The Online store conversion card on the Analytics page shows how many got to each step, so you can see where your store is losing sales.
Find the funnel
- From your Orbit dashboard, go to Analytics.
- Set the date range at the top right.
- Scroll to Online store conversion. It sits beside Sessions over time.
What each row shows
The card has five rows, one per step, with a bar that shrinks as shoppers fall away.
- Page Views: pages looked at on your store.
- Product Views: shoppers who opened a product page.
- Add to Cart: shoppers who put something in a cart.
- Checkout Started: shoppers who began checkout.
- Purchase: shoppers who paid.
Each row after the first shows a count and a share, such as (45.4% of sessions). Where a step lost shoppers, a red figure on the right shows how many dropped. The percentage at the top of the card is your conversion rate for the dates you set.
Note: The Total Sessions figure in the summary at the foot of the card counts page views, so it will not match the Sessions over time card beside it.
Work out where you are losing sales
- A big drop before Product Views: visitors are landing but not reaching a product. The problem is your home page, your category pages or the traffic itself, not checkout.
- A big drop at Add to Cart: the product page is not convincing. Look at your photos, your price, missing details such as sizes and delivery times, and whether you have reviews.
- A big drop at Checkout Started: delivery cost is the usual cause. Check what you charge against what shoppers expect, and look at your free delivery threshold.
- A big drop at Purchase: something went wrong during payment. Check that the payment methods your customers want are switched on, and look at your abandoned checkouts to see how far they got.
Fix one step at a time
- Find the single biggest drop. That is your bottleneck.
- Change that one step.
- Measure again a week later.
- Only then move on to the next step.
Tip: A small gain at your worst step beats polishing your best one. Every step below it carries the gain through.
Related guides
Was this helpful?
0 people found this helpful