Running and exporting a report
Open Reports in Orbit, search or filter the 34 reports, set your dates and comparison, run a report and download it as CSV, Excel or PDF.
5 min read14viewsUpdated 14 September 2026Orbit Commerce
Reports give you the detailed figures behind your store: sales, orders, customers, finances, inventory and traffic. You open a report, it runs on the dates you set, and you download it as CSV, Excel or PDF.
Considerations
- Set the dates and the comparison before you open a report. An open report covers the whole screen, so the controls behind it cannot be reached.
- Every report can be exported. Only some reports can compare one period with another. Those carry a Comparison badge.
- Two reports need the Enterprise plan. They carry a lock and an Enterprise badge, and open on an upgrade message instead of figures.
Open Reports
- From your Orbit dashboard, go to Analytics.
- Click Reports in the submenu.
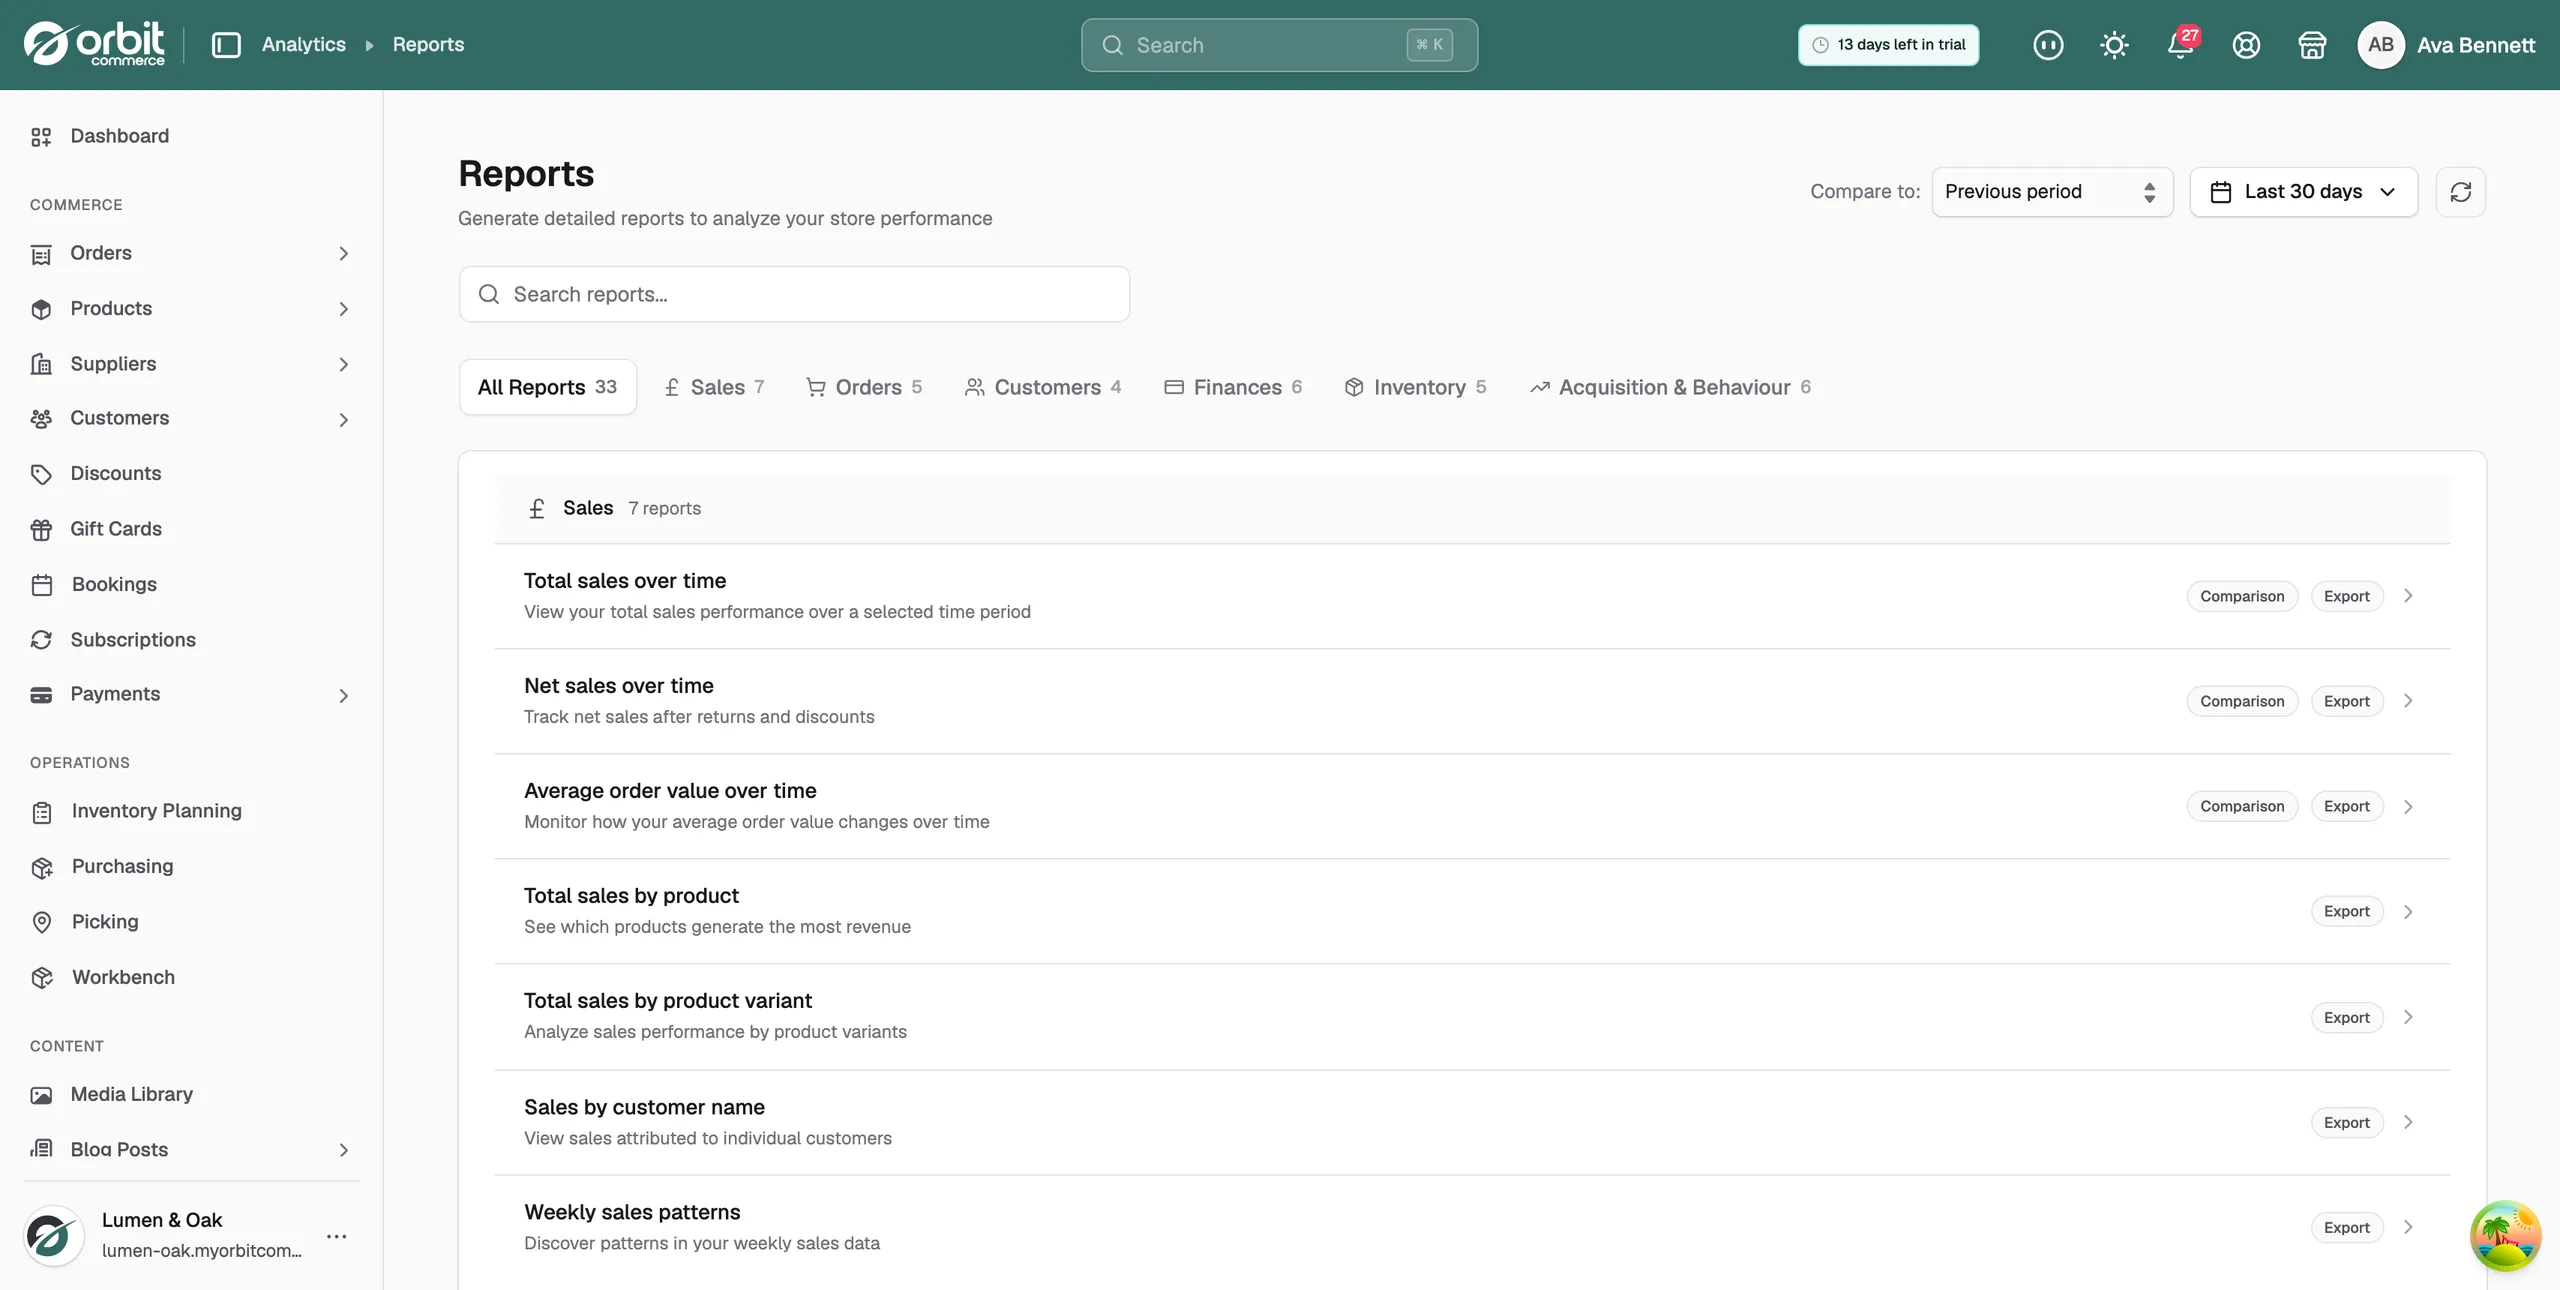
- The Reports page opens on the All Reports tab, with every report grouped by category.
Find a report
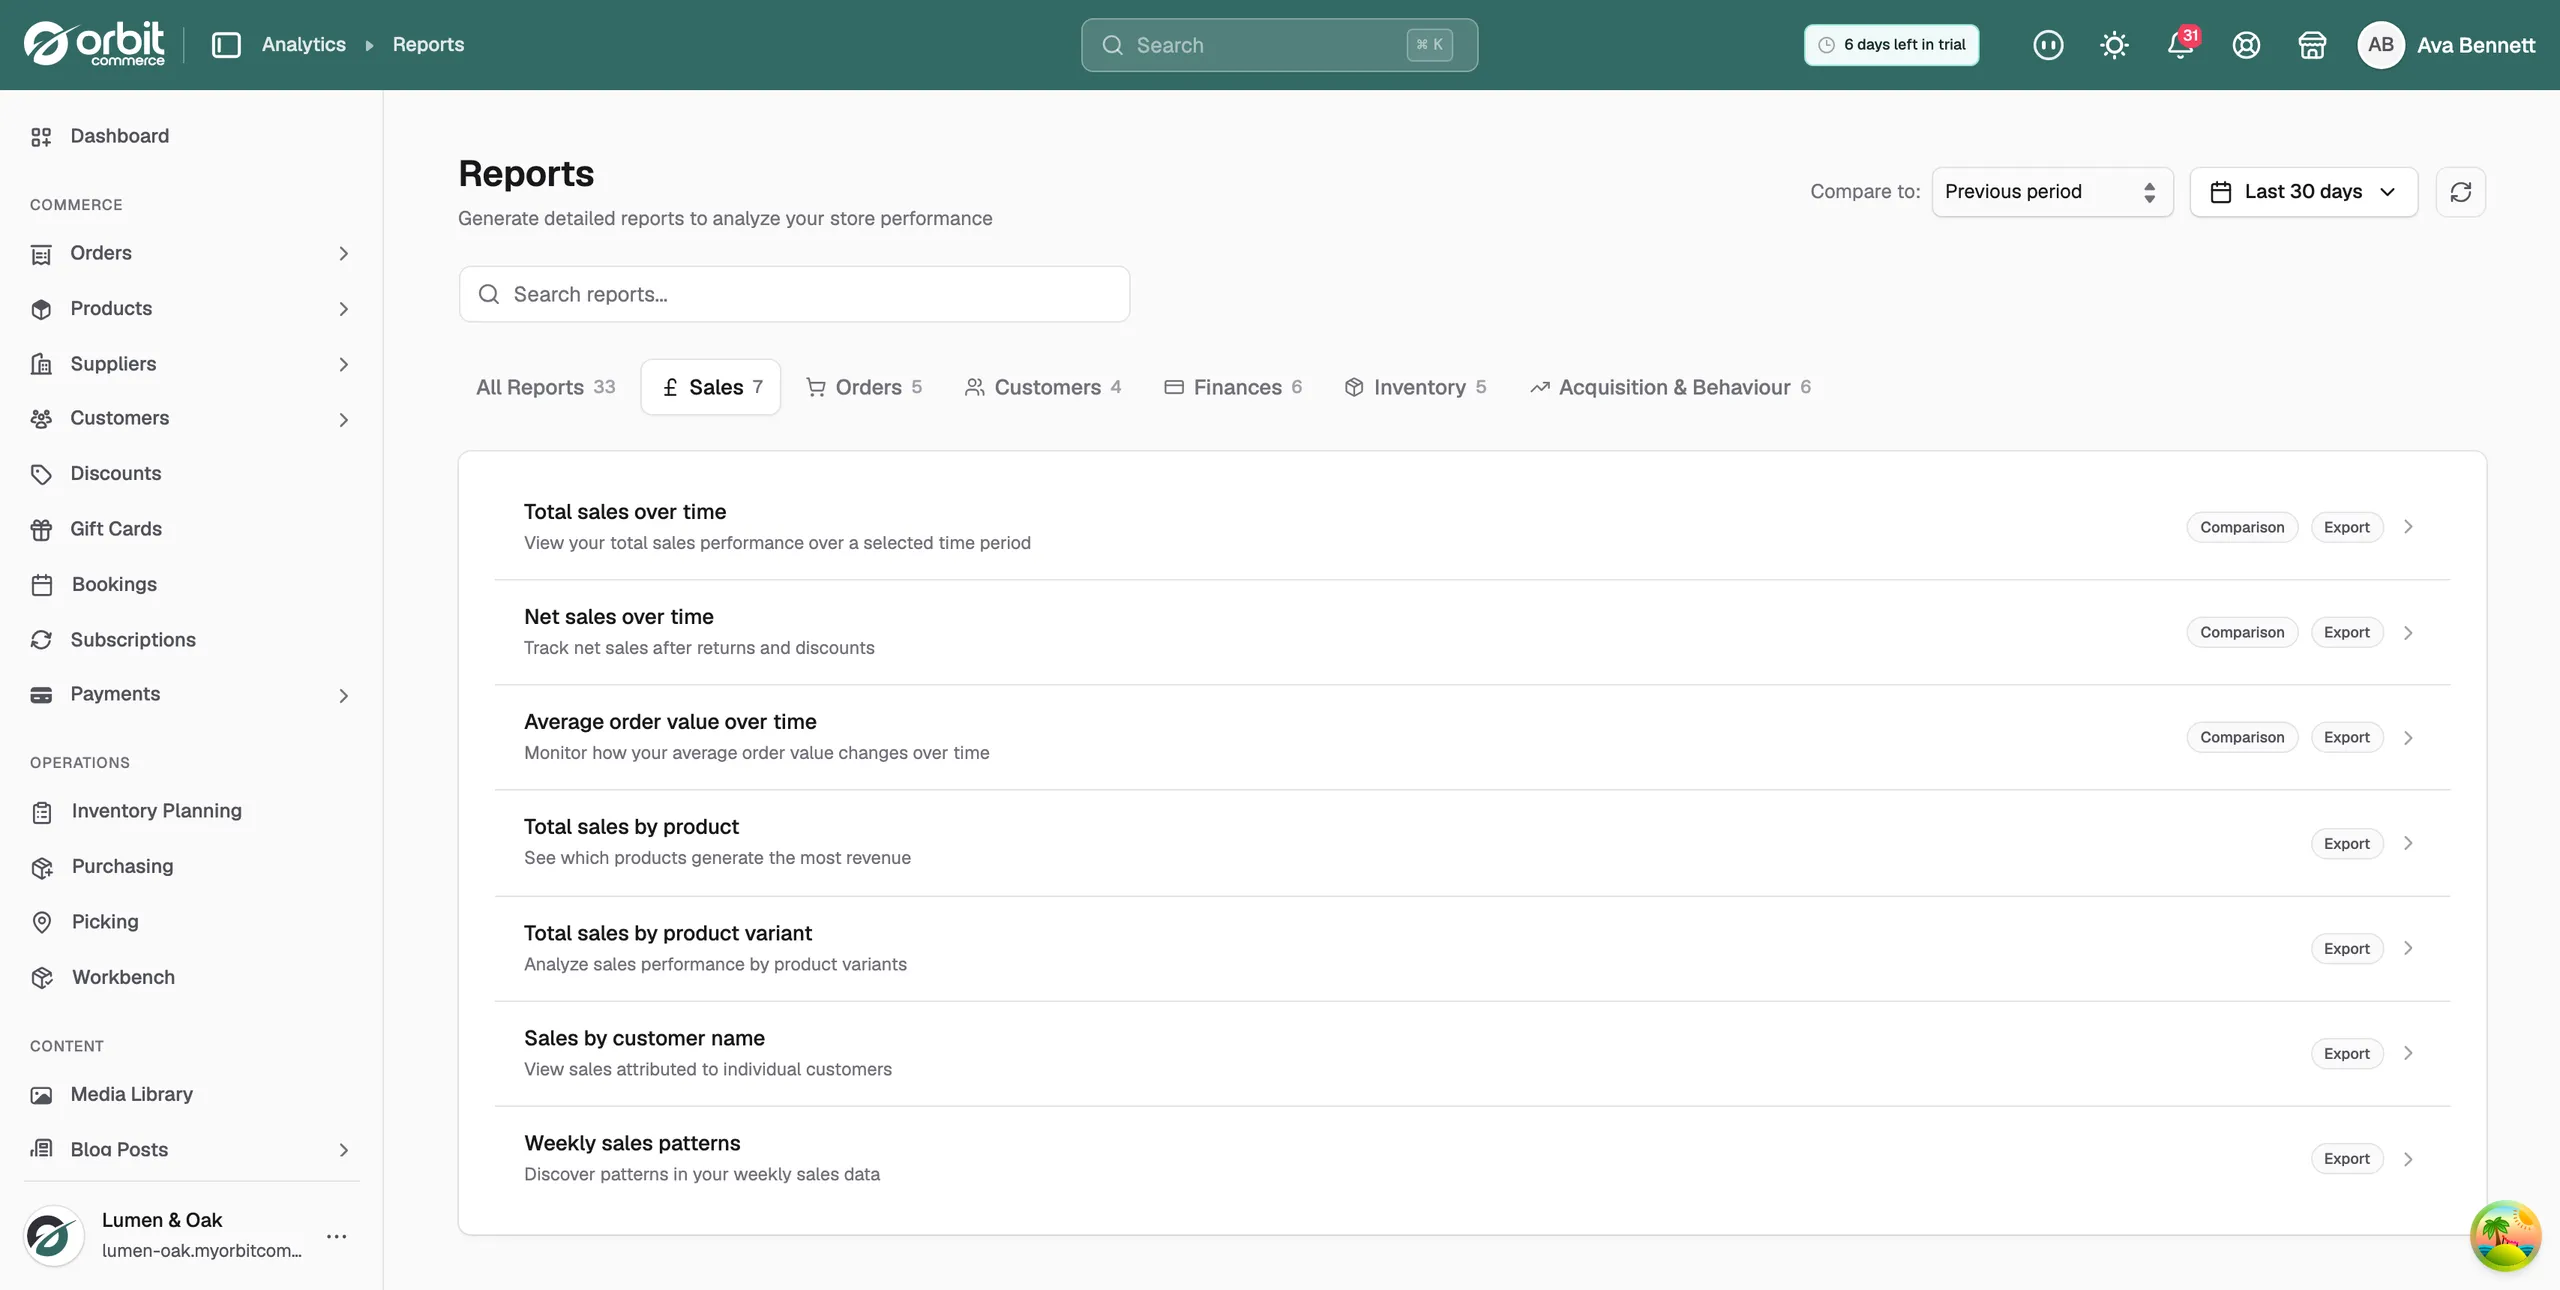
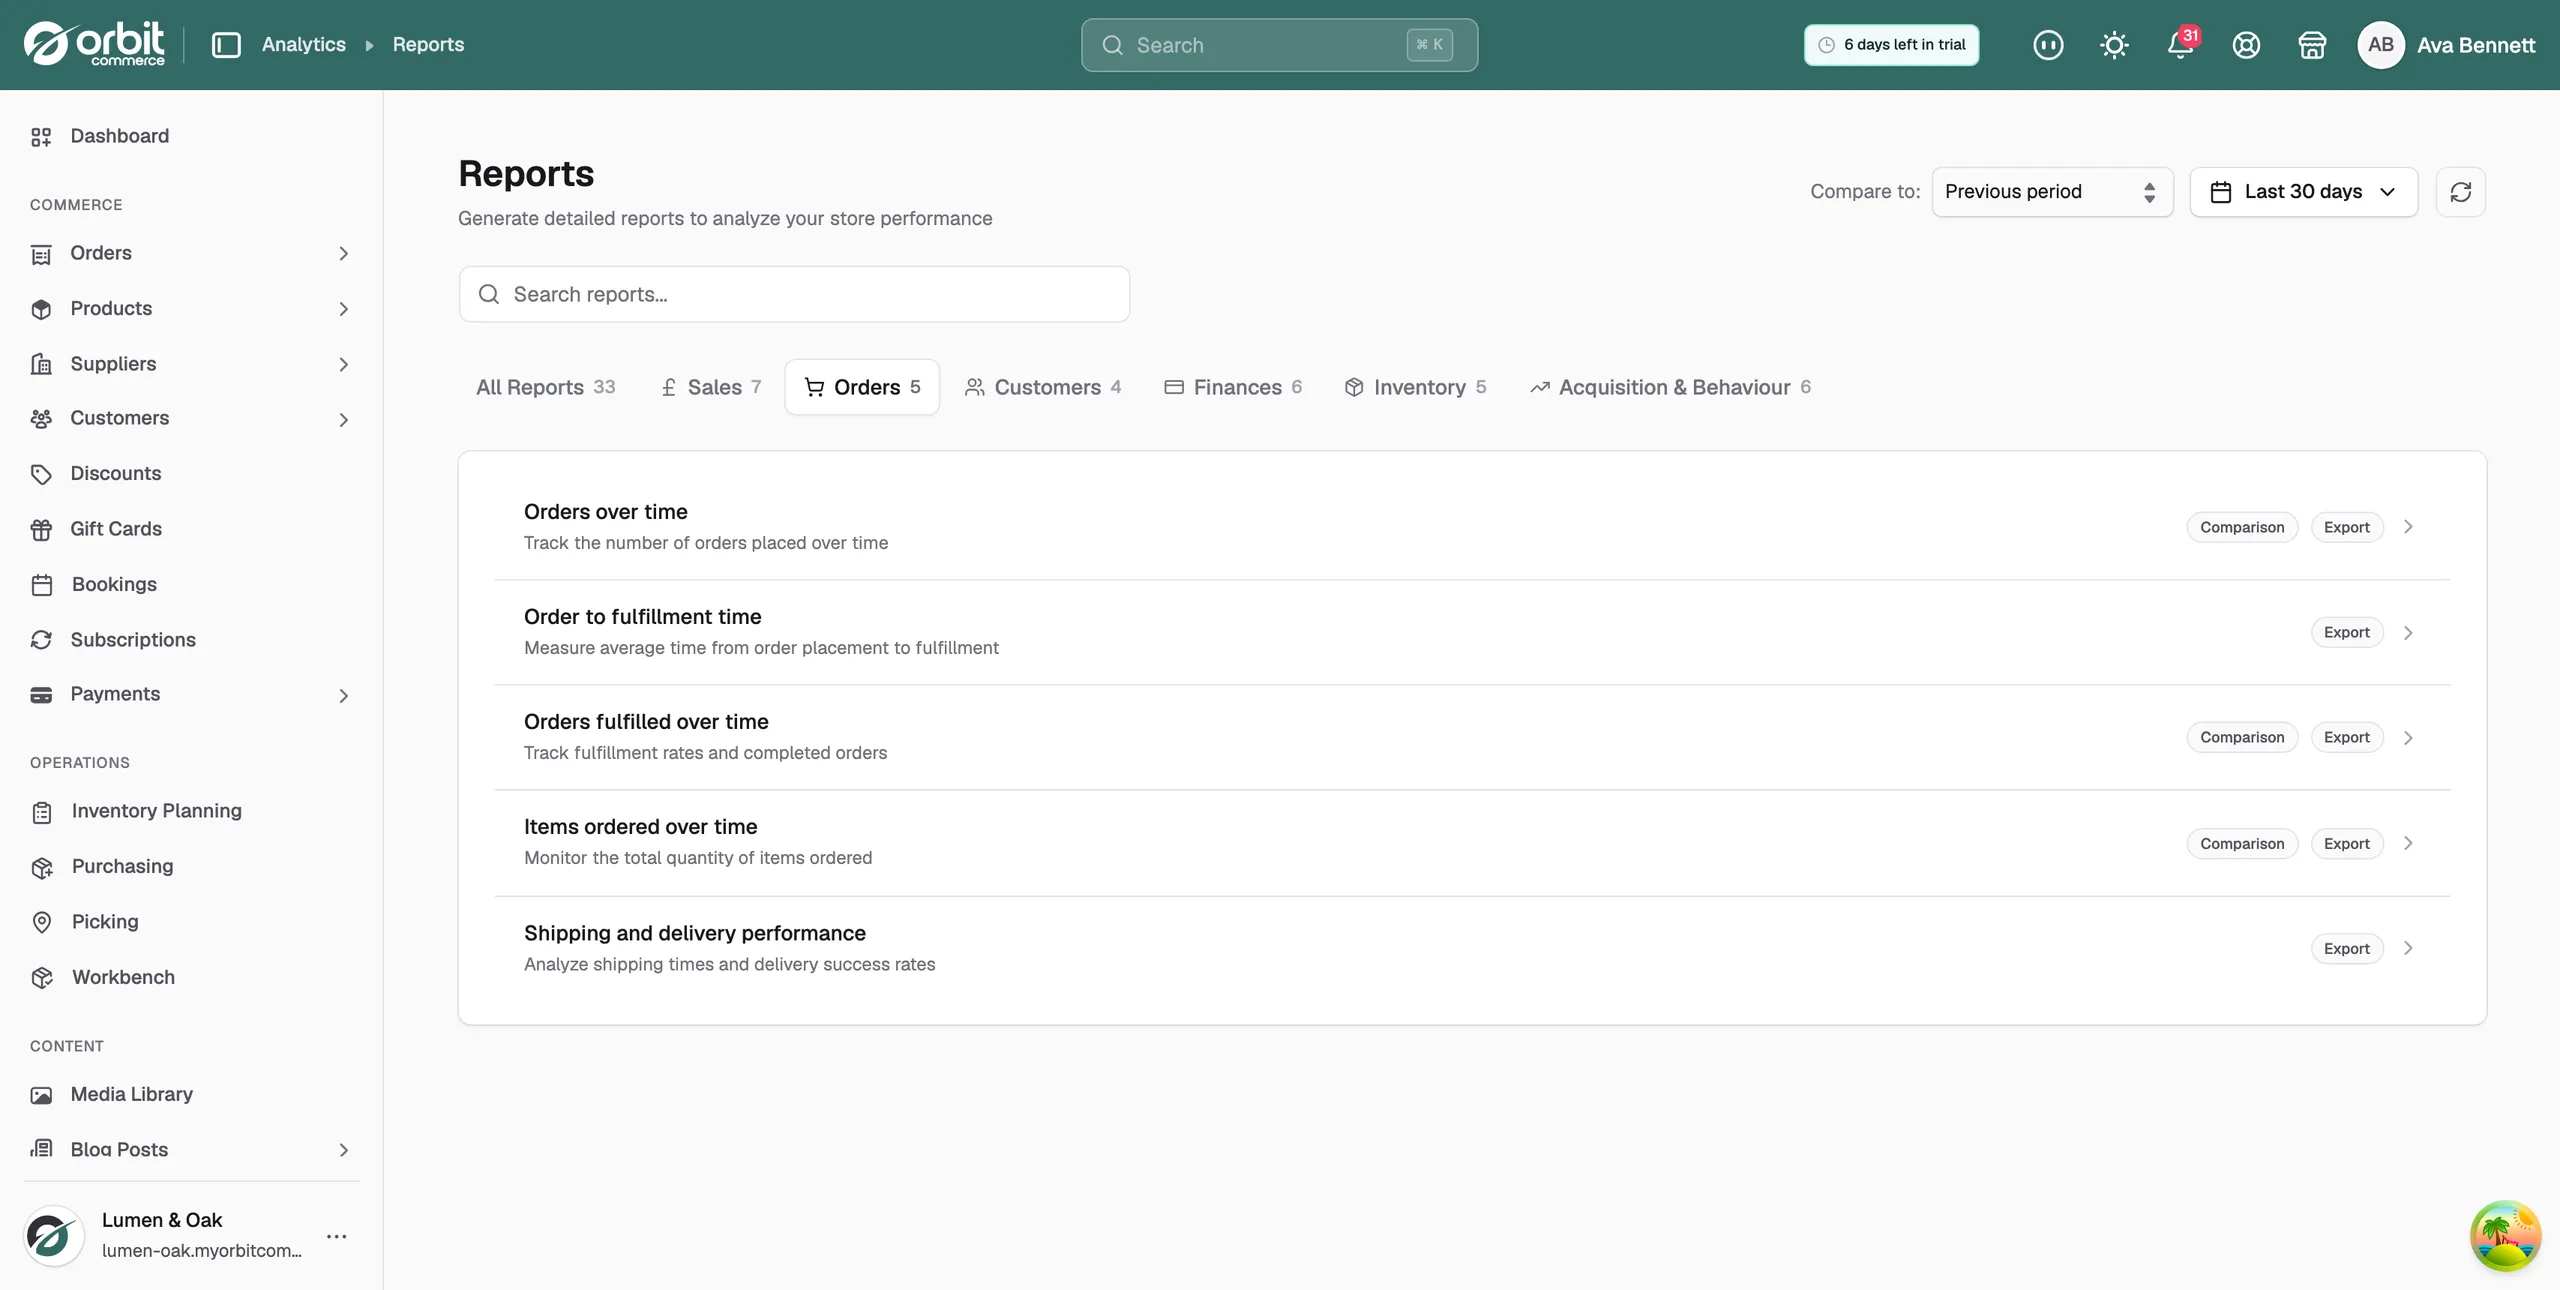
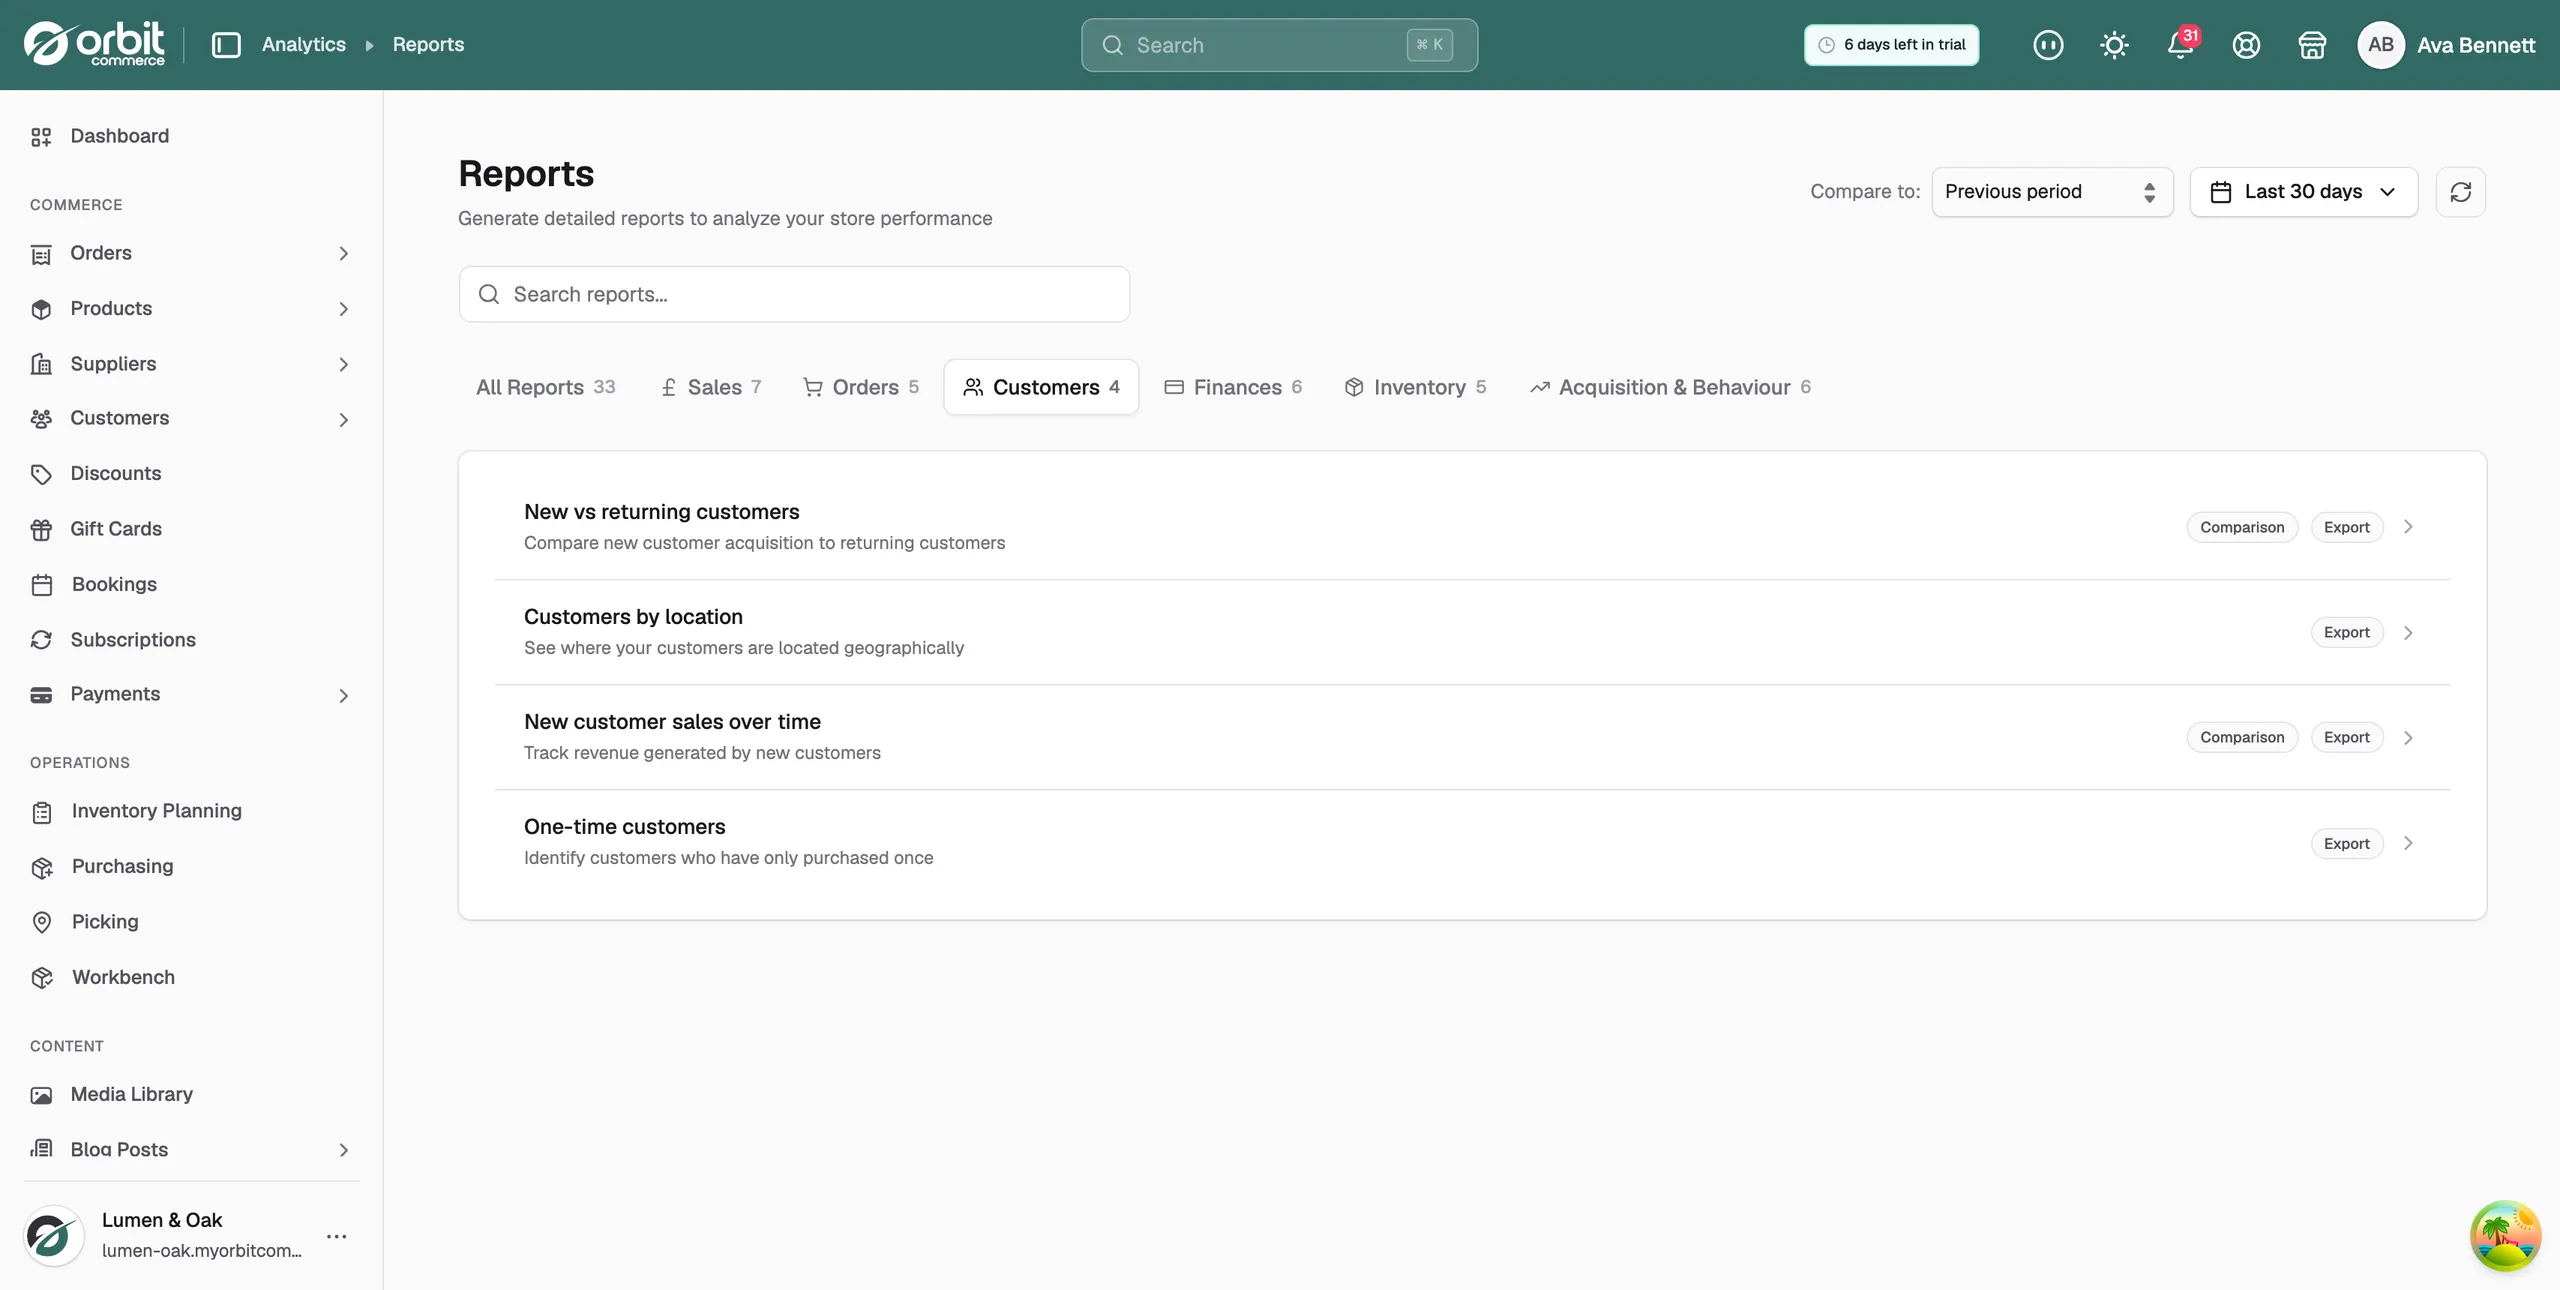
- Click a category tab to see that group on its own: Sales, Orders, Customers, Finances, Inventory or Acquisition & Behaviour. All Reports shows every one.
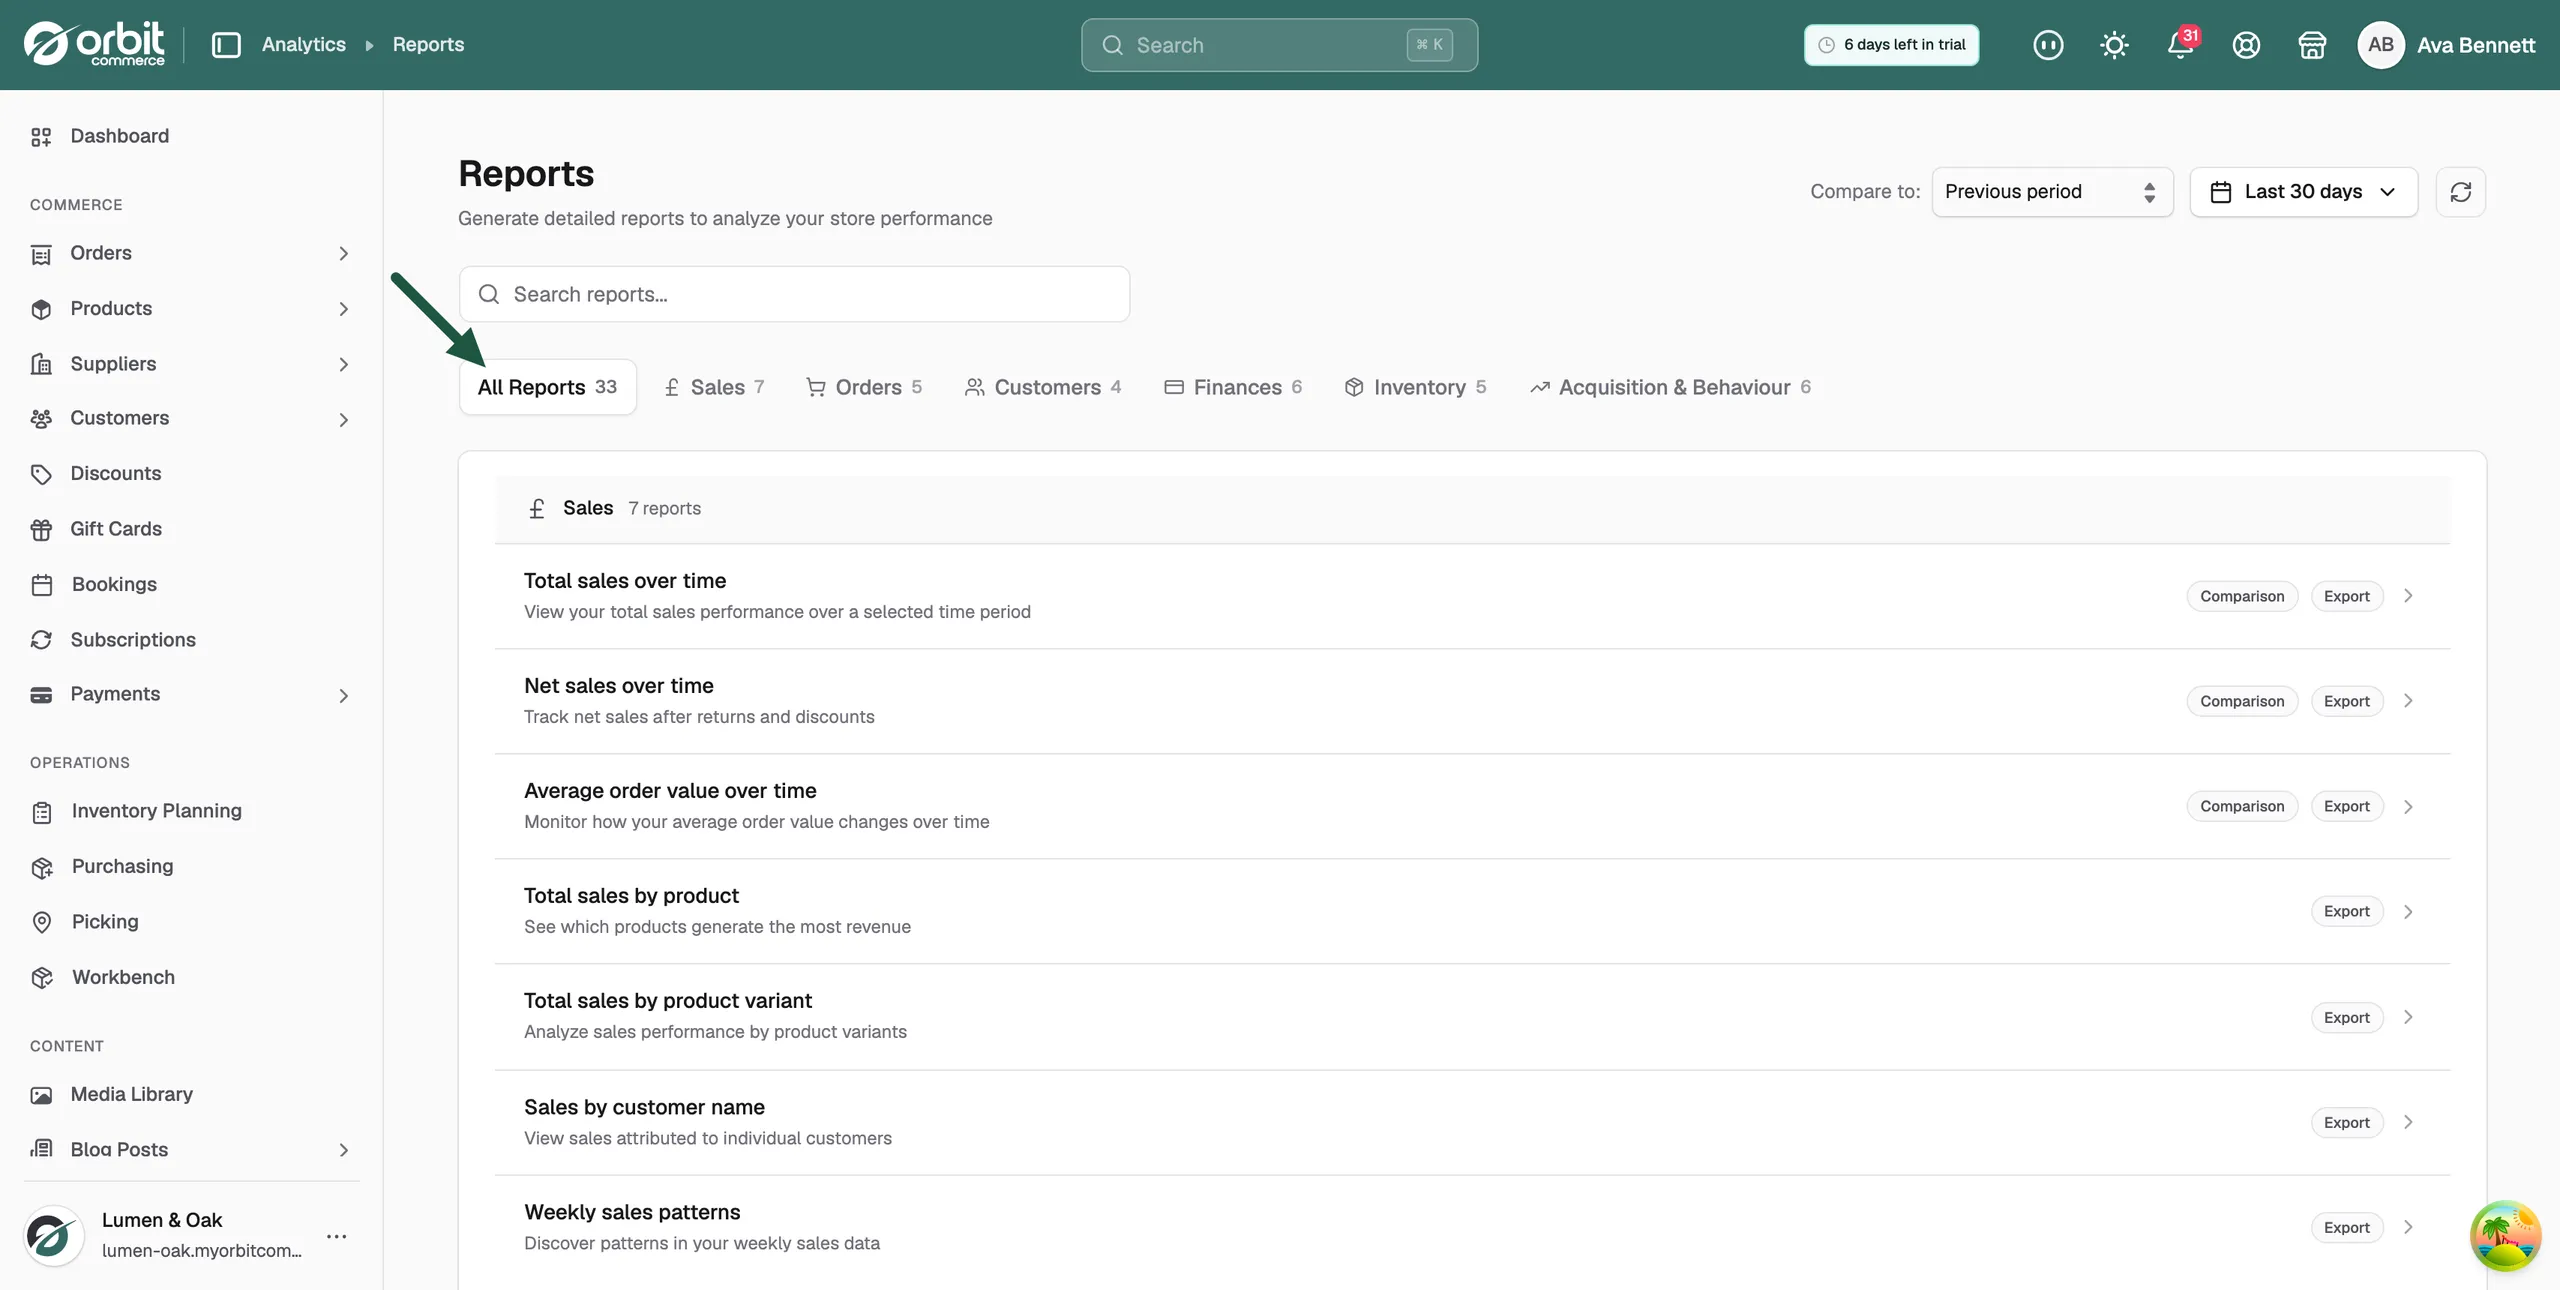
- Or type a word into Search reports... at the top of the page.
- On All Reports, the search covers every category at once. On a category tab, it covers that tab only.
- The number beside each tab shows how many reports match.
Note: The search field has no clear button. Delete the text to bring the full list back.
Choose the dates and the comparison
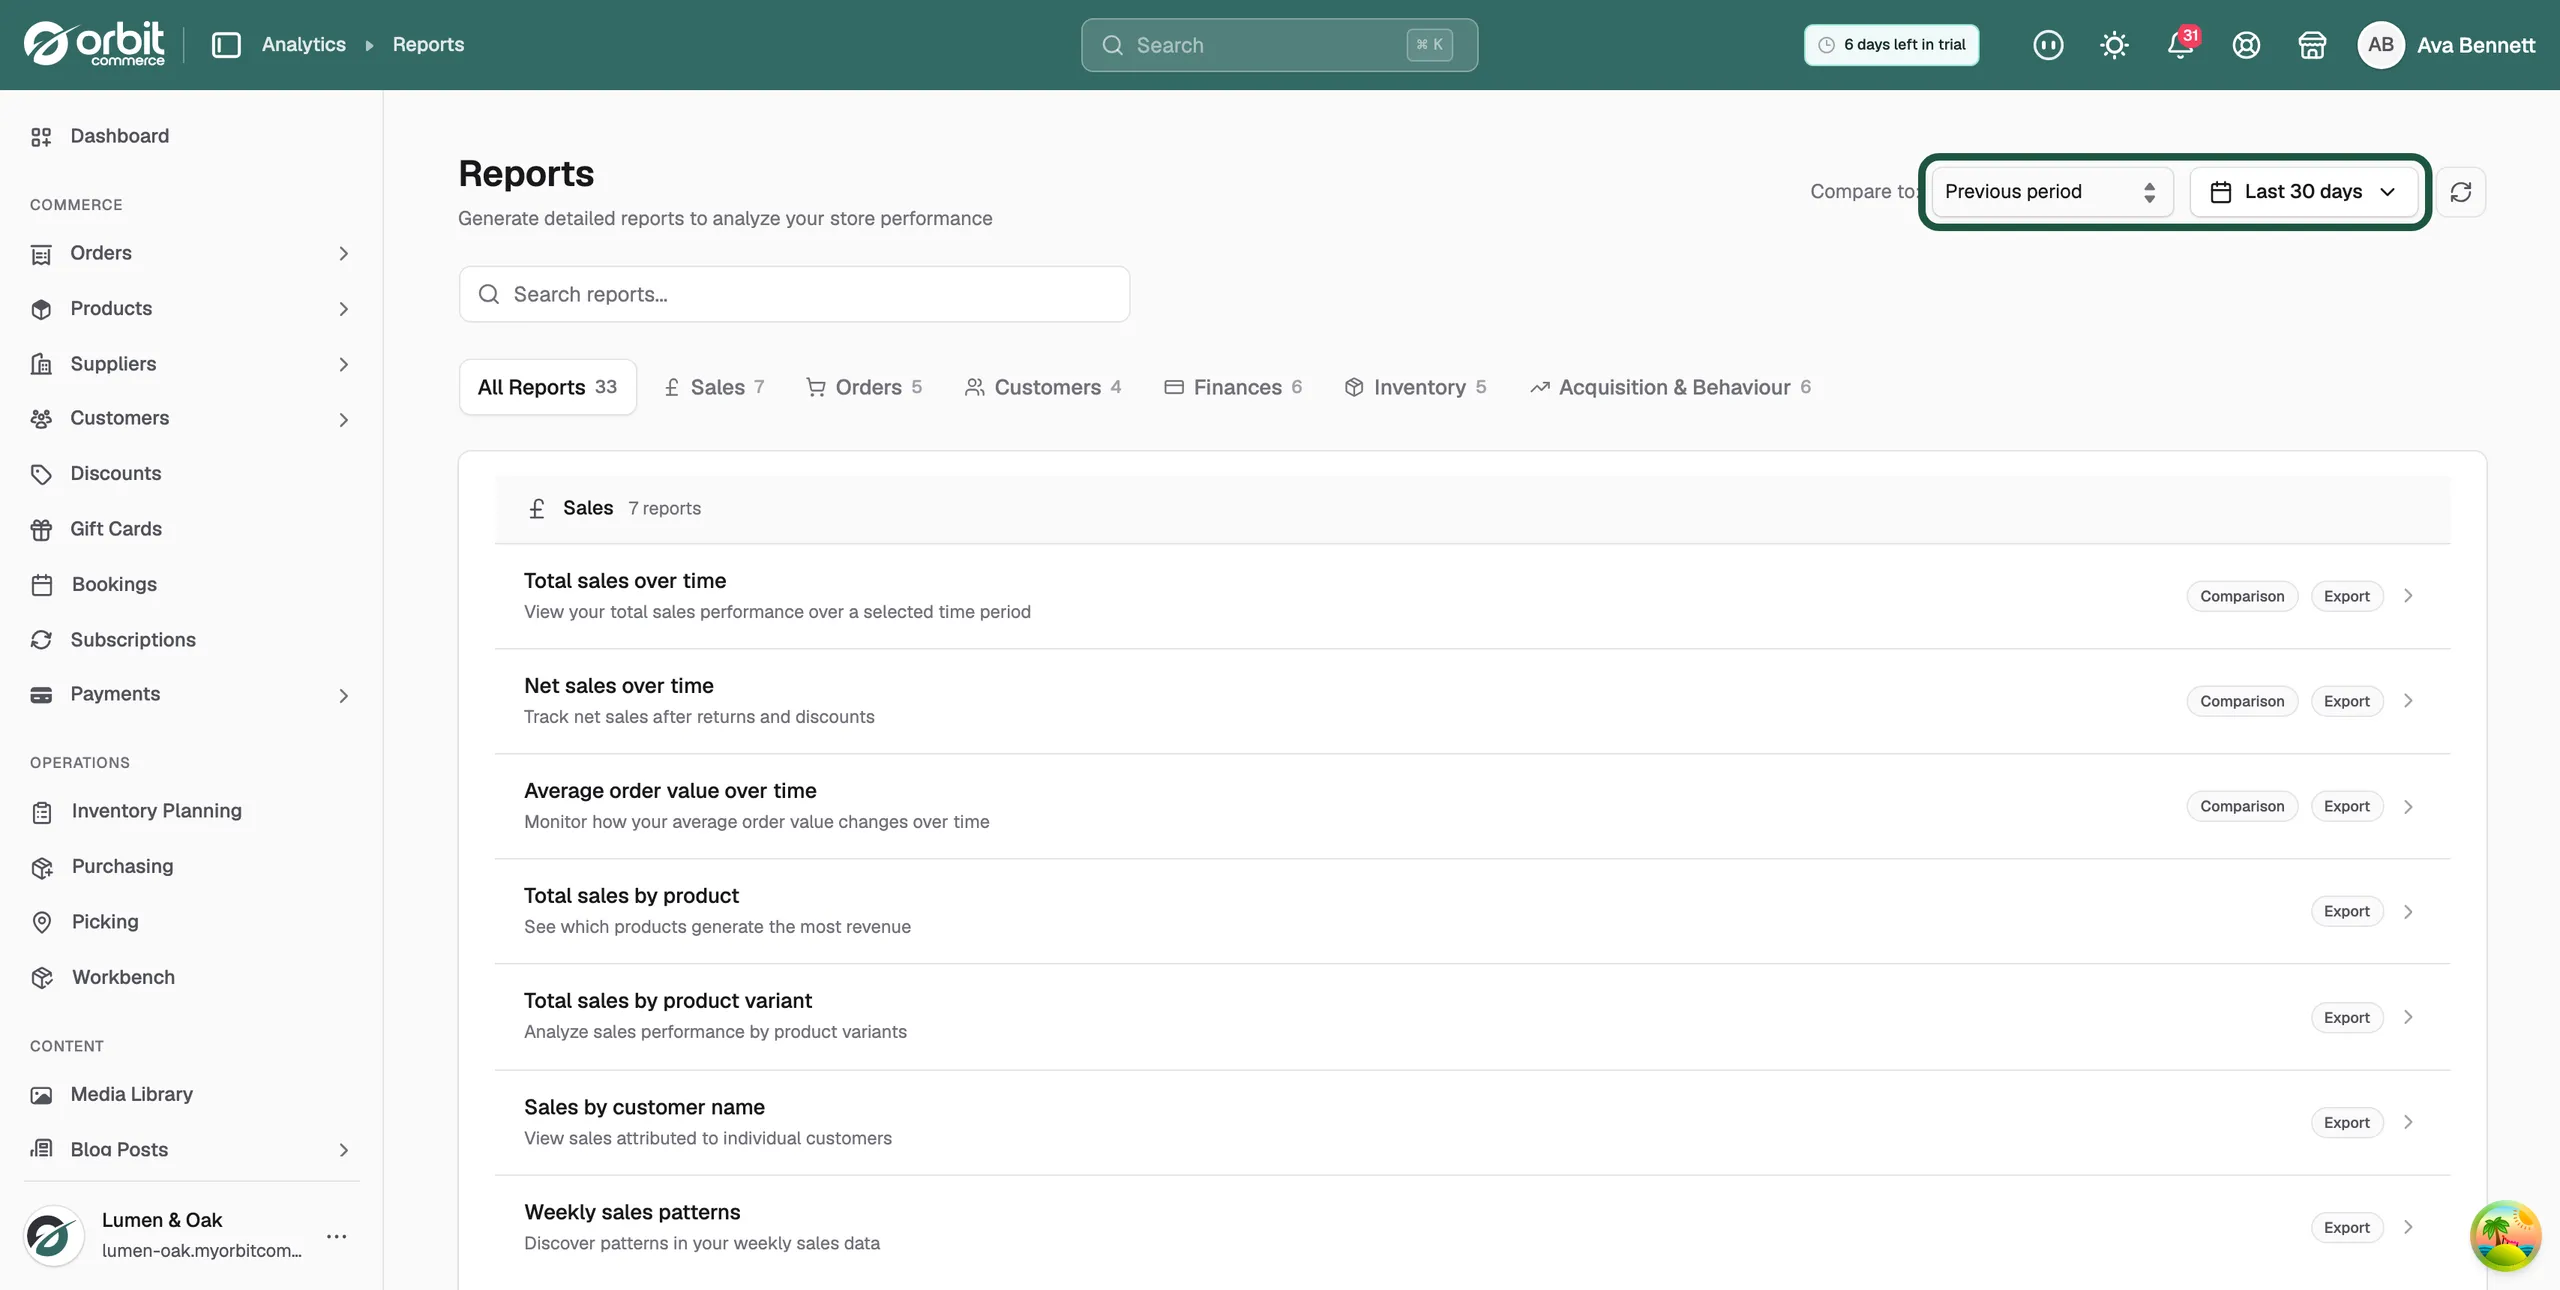
- Click the date button at the top right. It reads Last 30 days until you change it.
- Pick Today, Yesterday, Last 7 days, Last 30 days, Last 90 days, Last 365 days or Custom. A tick marks the one in use.
- For Custom, set Start date and End date, then click Apply.
- Beside the date button, set Compare to: to Previous period, Previous year or No comparison. Previous period is already chosen.
- The list does not reload. Every report you open from now on uses these settings.
Open a report
- Click anywhere on the report row. The whole row is the button.
- The report runs and opens over your list. It shows the report name, your date range, and a chart or table.
- The bar under the title shows Total: and the figure for your dates. Money figures show the currency code and a rounded number, such as GBP 34.9K.
- Where a comparison ran, the same bar shows vs previous period: and the change as a percentage.
- On a chart, the solid line is your current period and the dashed line is the period before.
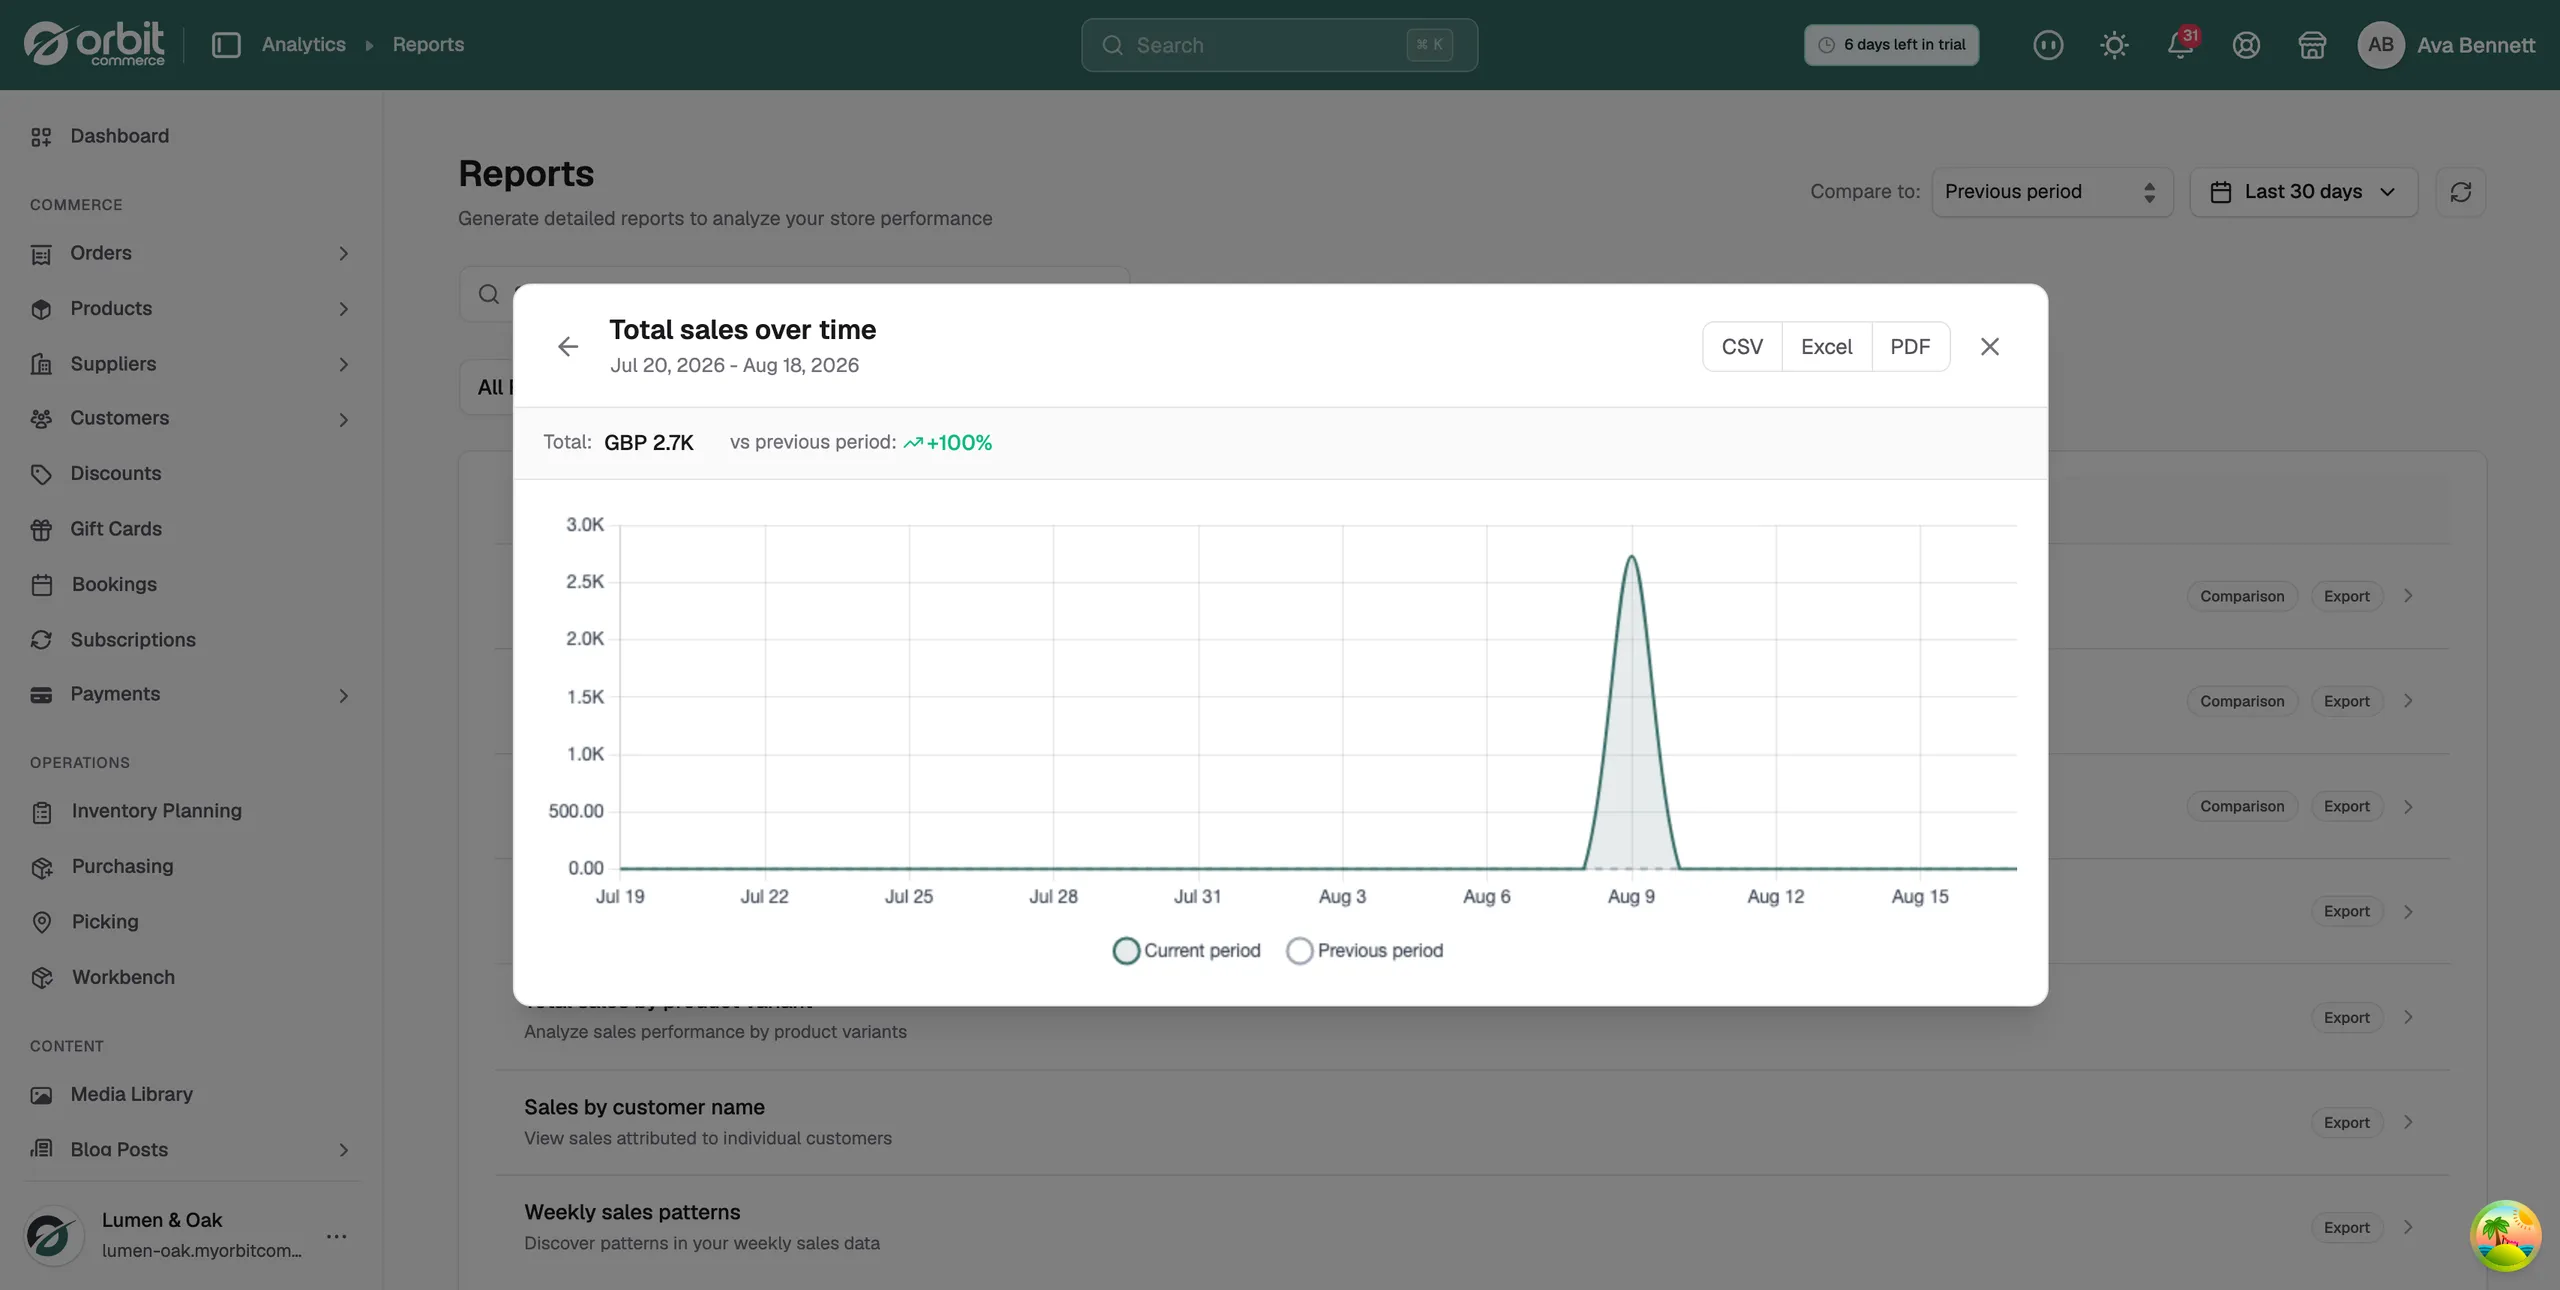
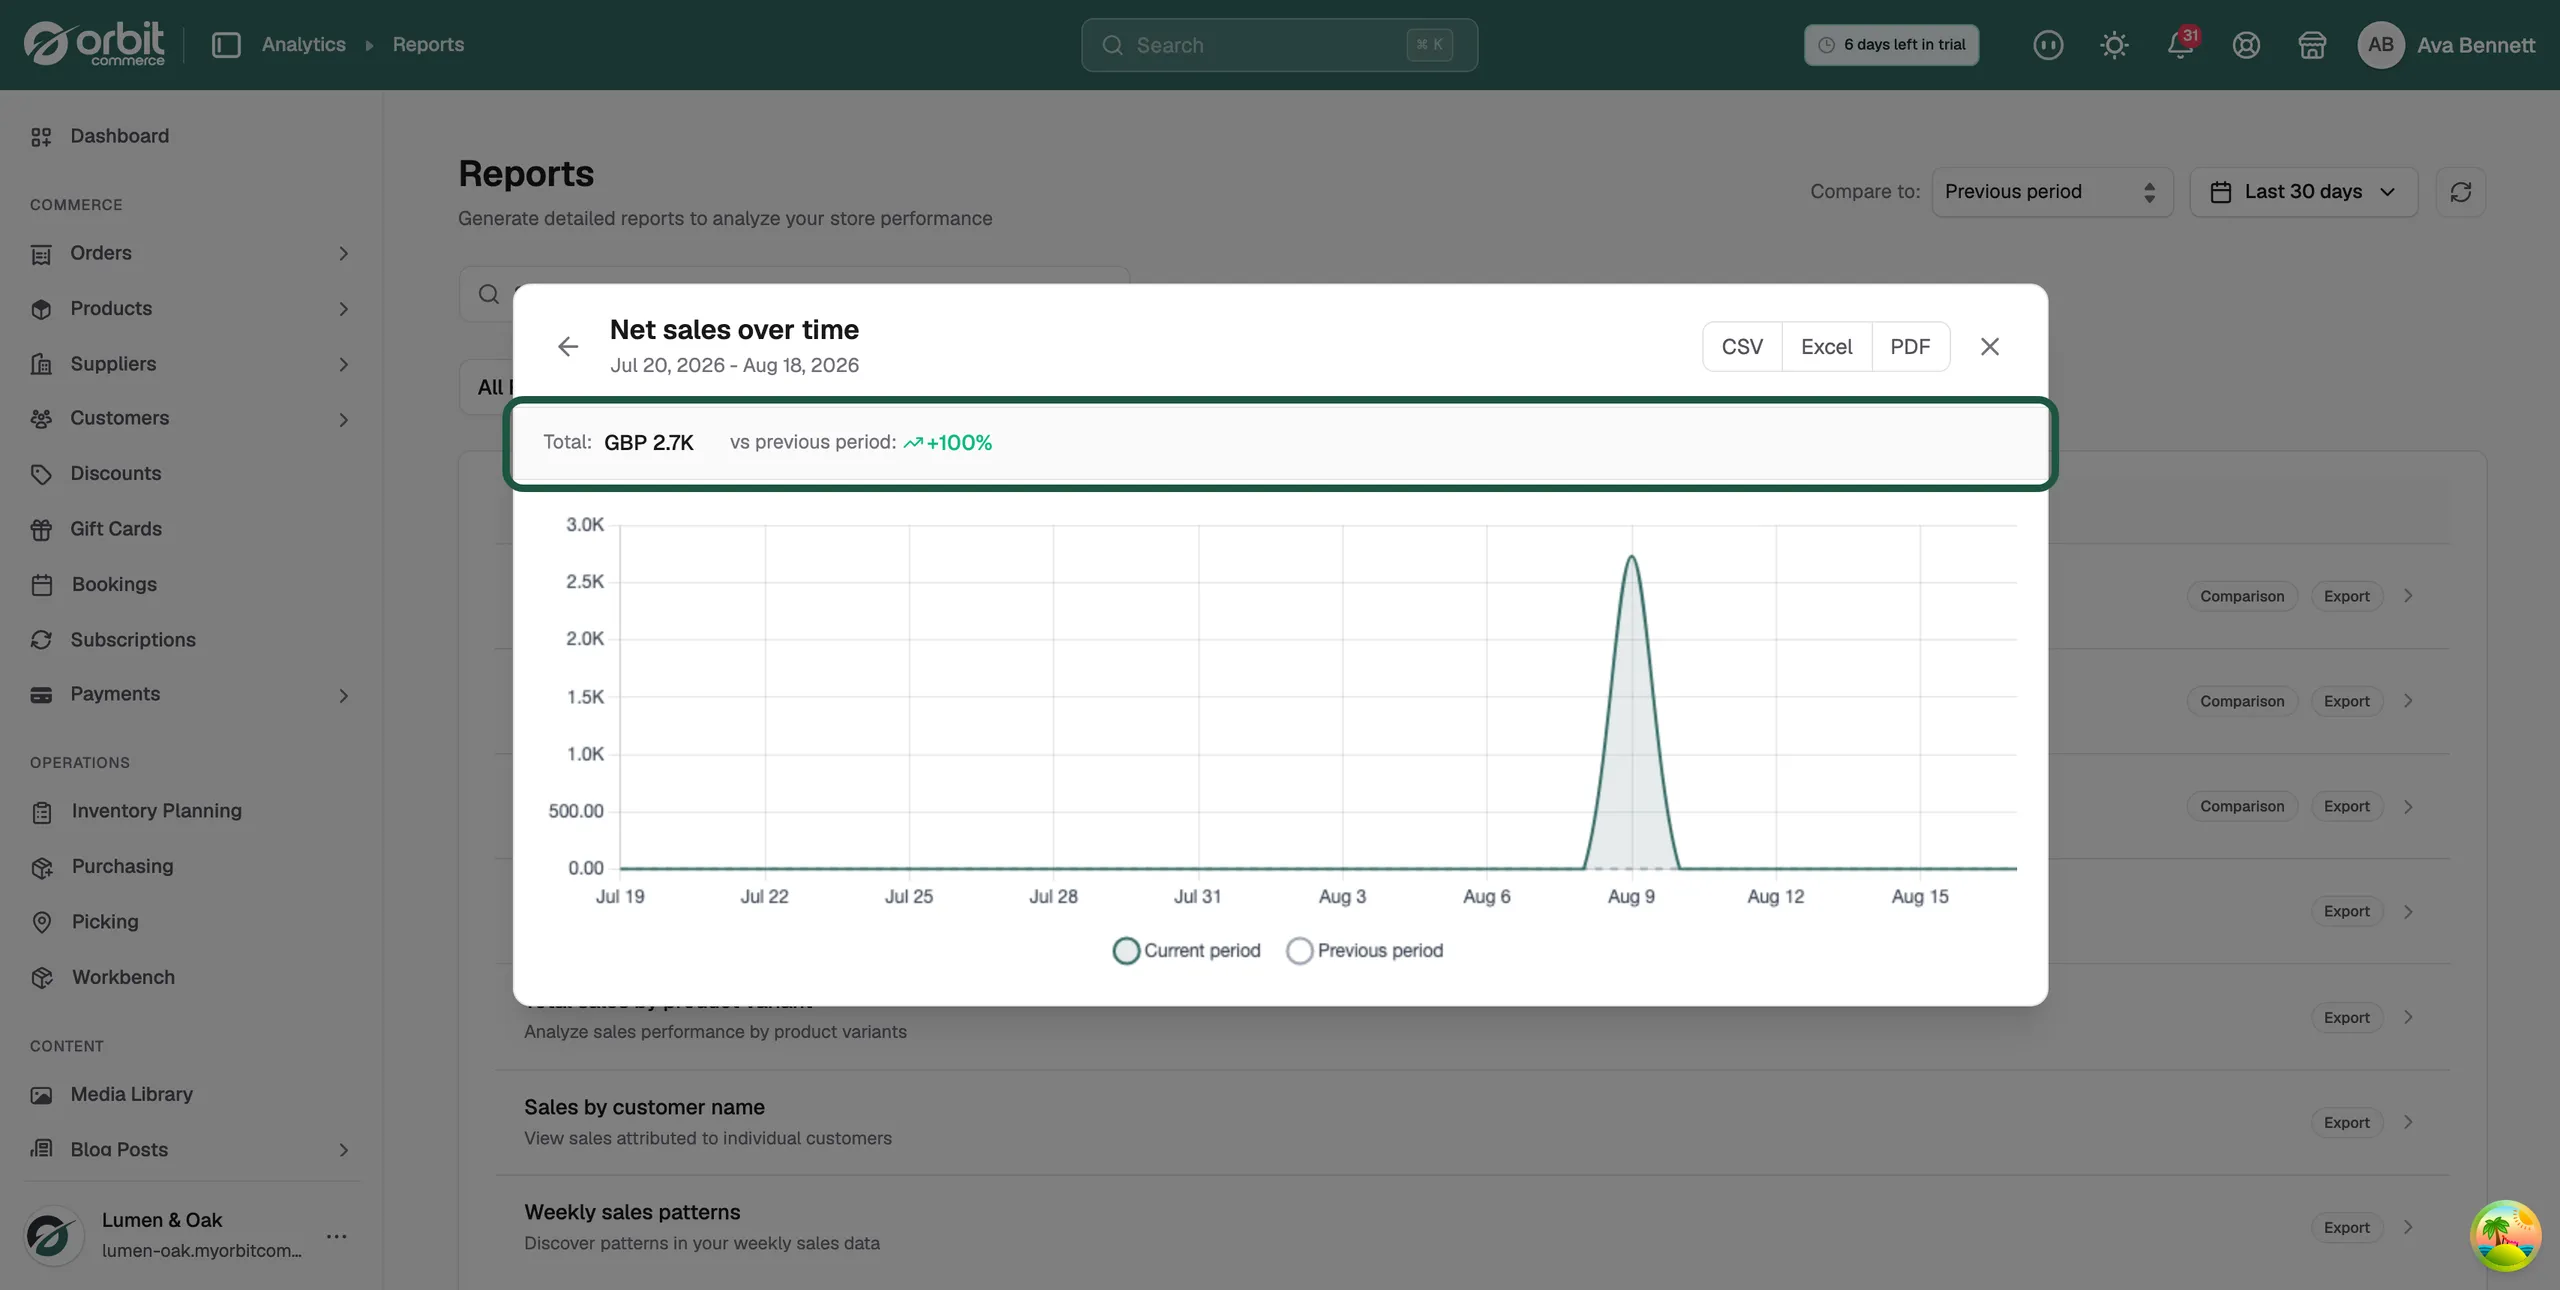
Note: To close a report, click the arrow at the top left, the × at the top right, or the dimmed area around it.
Export a report
- Open the report you want.
- At the top right of the report, click CSV, Excel or PDF.
- The file downloads. Nothing else changes on screen, so check your browser downloads.
- The file is named after the report and the dates you set, and holds the same figures you are reading.
What is in each category
Sales
- Total sales over time: your total sales performance across the period.
- Net sales over time: sales after returns and discounts.
- Average order value over time: how your average order value moves.
- Total sales by product: which products earn the most.
- Total sales by product variant: the same, split by variant.
- Total sales by bundle: revenue and kits sold for each bundle.
- Sales by customer name: sales against each customer.
- Weekly sales patterns: patterns in your weekly sales.
Orders
- Orders over time: how many orders were placed.
- Order to fulfillment time: average time from order to fulfilment.
- Orders fulfilled over time: fulfilment rates and completed orders.
- Items ordered over time: total quantity of items ordered.
- Shipping and delivery performance: delivery times and success rates.
Customers
- New vs returning customers: new buyers against repeat buyers.
- Customers by location: where your customers are.
- New customer sales over time: revenue from new customers.
- One-time customers: customers who bought once.
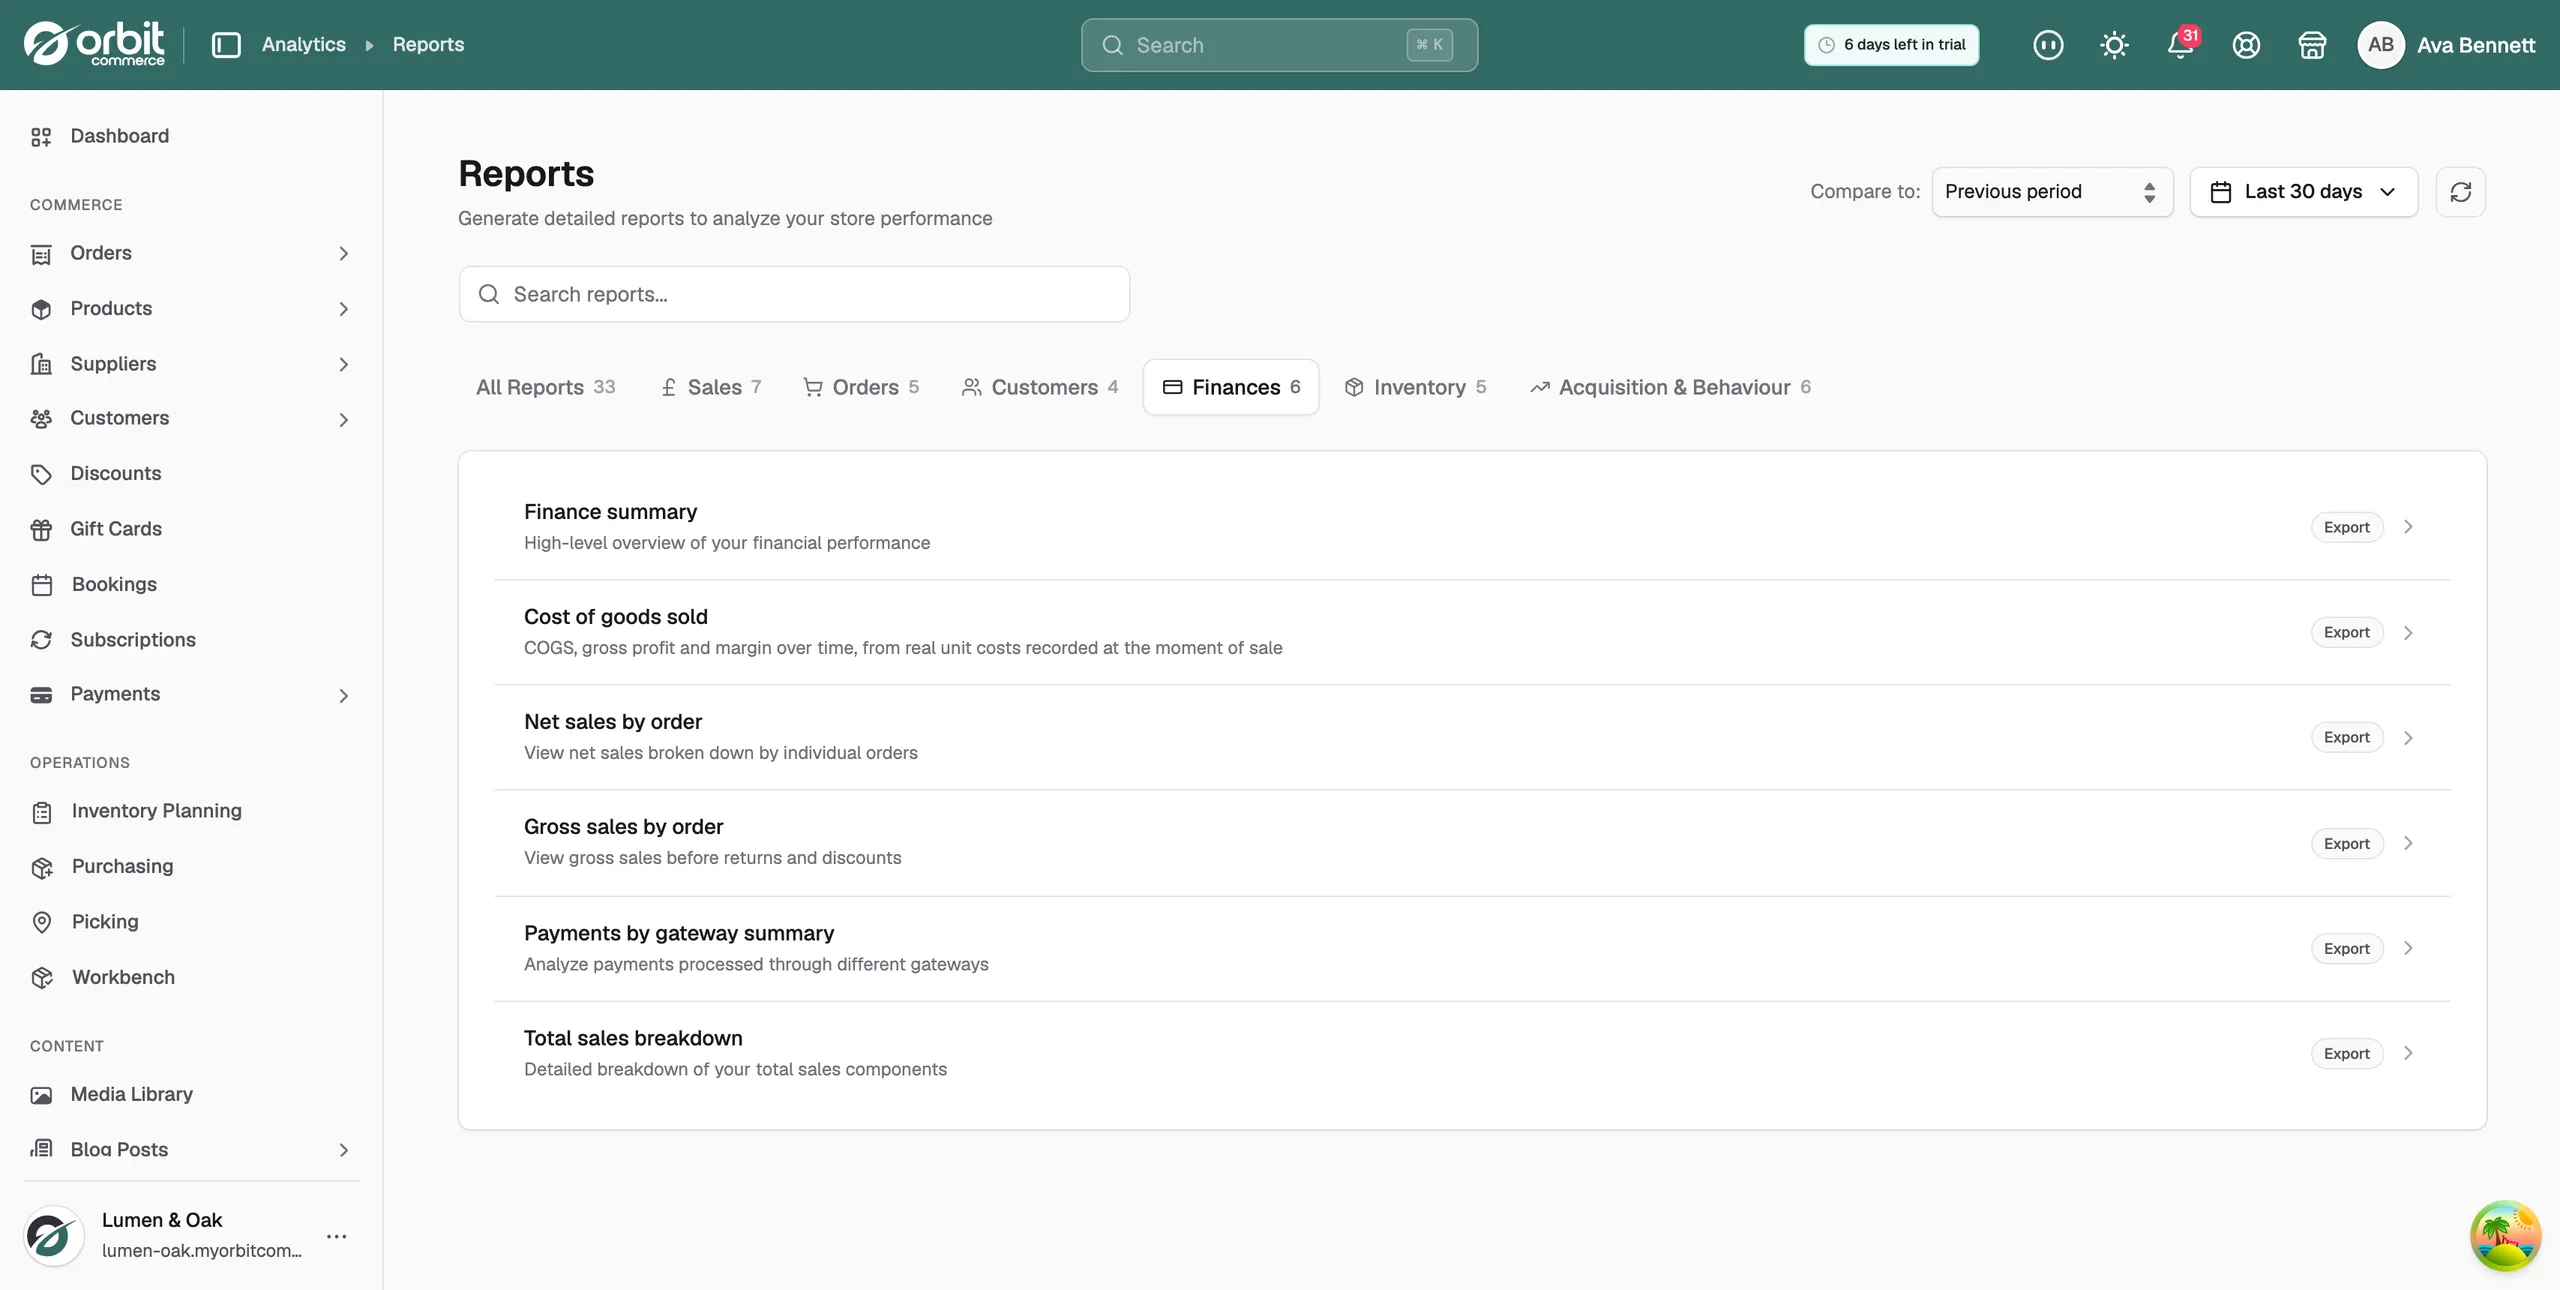
Finances
- Finance summary: an overview of your financial performance.
- Cost of goods sold: cost, gross profit and margin over time. Enterprise only.
- Net sales by order: net sales for each order.
- Gross sales by order: gross sales before returns and discounts.
- Payments by gateway summary: payments split by gateway.
- Total sales breakdown: the parts that make up your total sales.
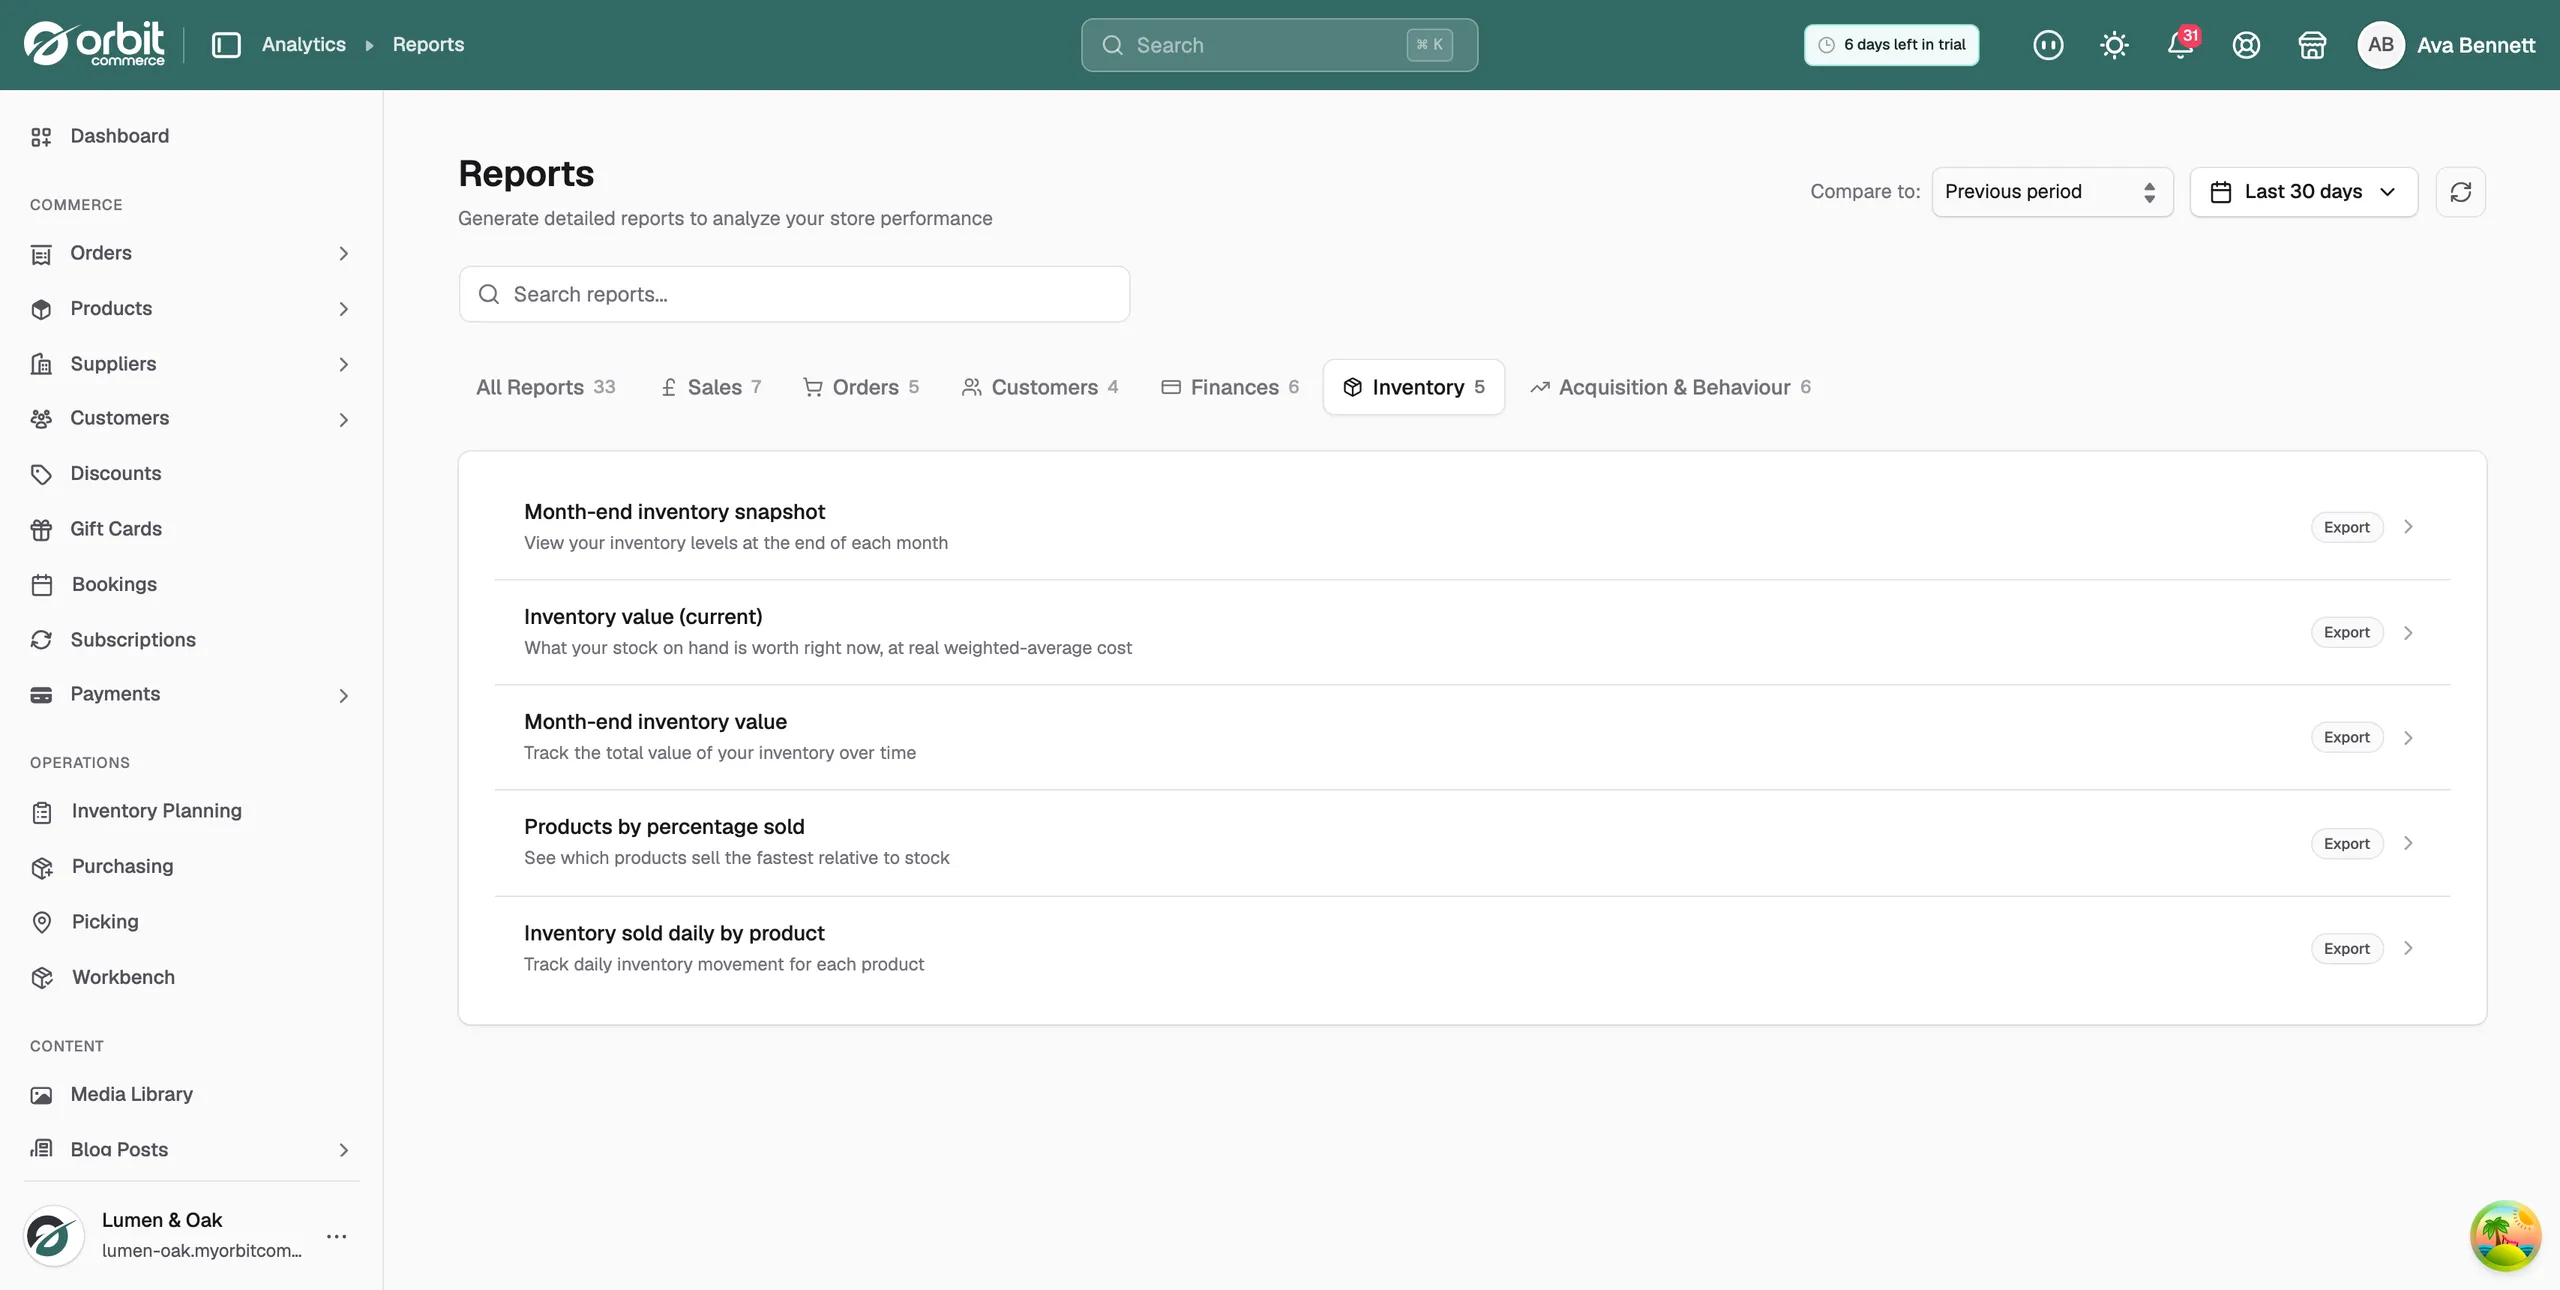
Inventory
- Month-end inventory snapshot: stock levels at the end of each month.
- Inventory value (current): what your stock is worth now. Enterprise only.
- Month-end inventory value: the value of your stock over time.
- Products by percentage sold: which products sell fastest against stock held.
- Inventory sold daily by product: daily stock movement per product.
Acquisition & Behaviour
- Sessions over time: visits to your store.
- Visitors over time: unique visitors.
- Sessions by location: where your traffic comes from.
- Conversion rate over time: your conversion rate across the period.
- Searches by search query: what customers search for.
- Storefront searches: search behaviour and popular terms.
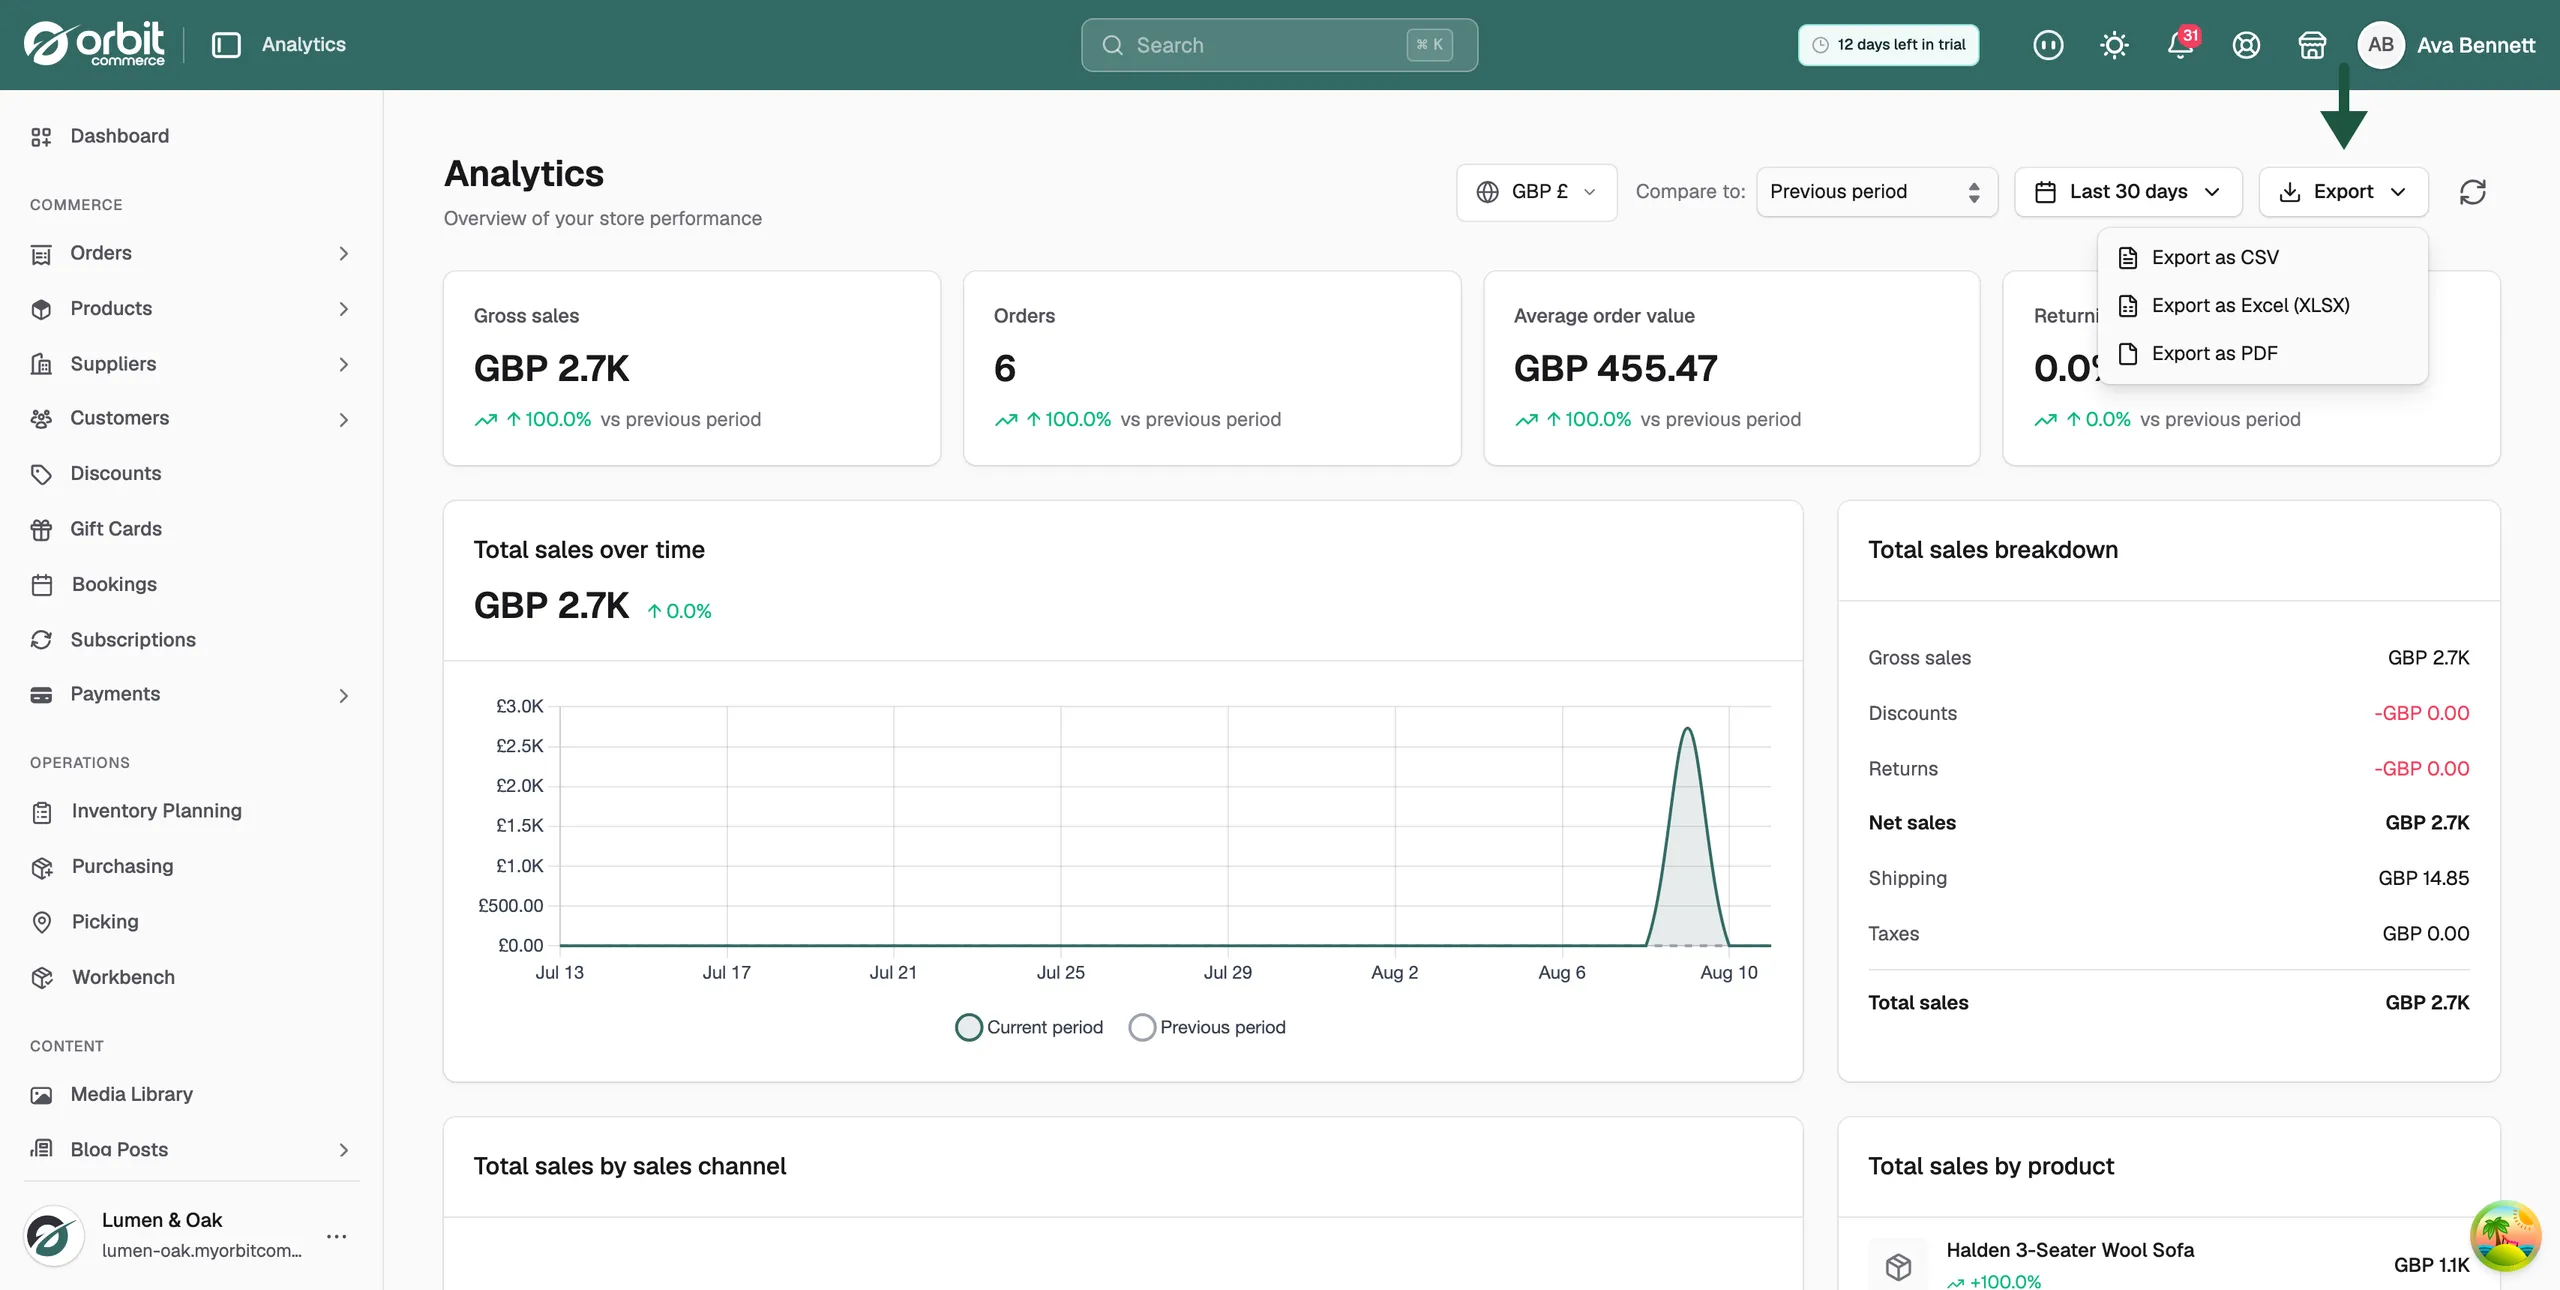
Export the Analytics page
- Go to Analytics.
- Set the date range and Compare to: you want.
- Click Export at the top right.
- Choose Export as CSV, Export as Excel (XLSX) or Export as PDF.
- The file downloads and holds the figures shown on the page.
Related guides
Was this helpful?
0 people found this helpful