Reading the dashboard metric cards
What Sessions, Total sales, Orders and Conversion rate count on your Orbit dashboard, how to change the dates, and what to watch for.
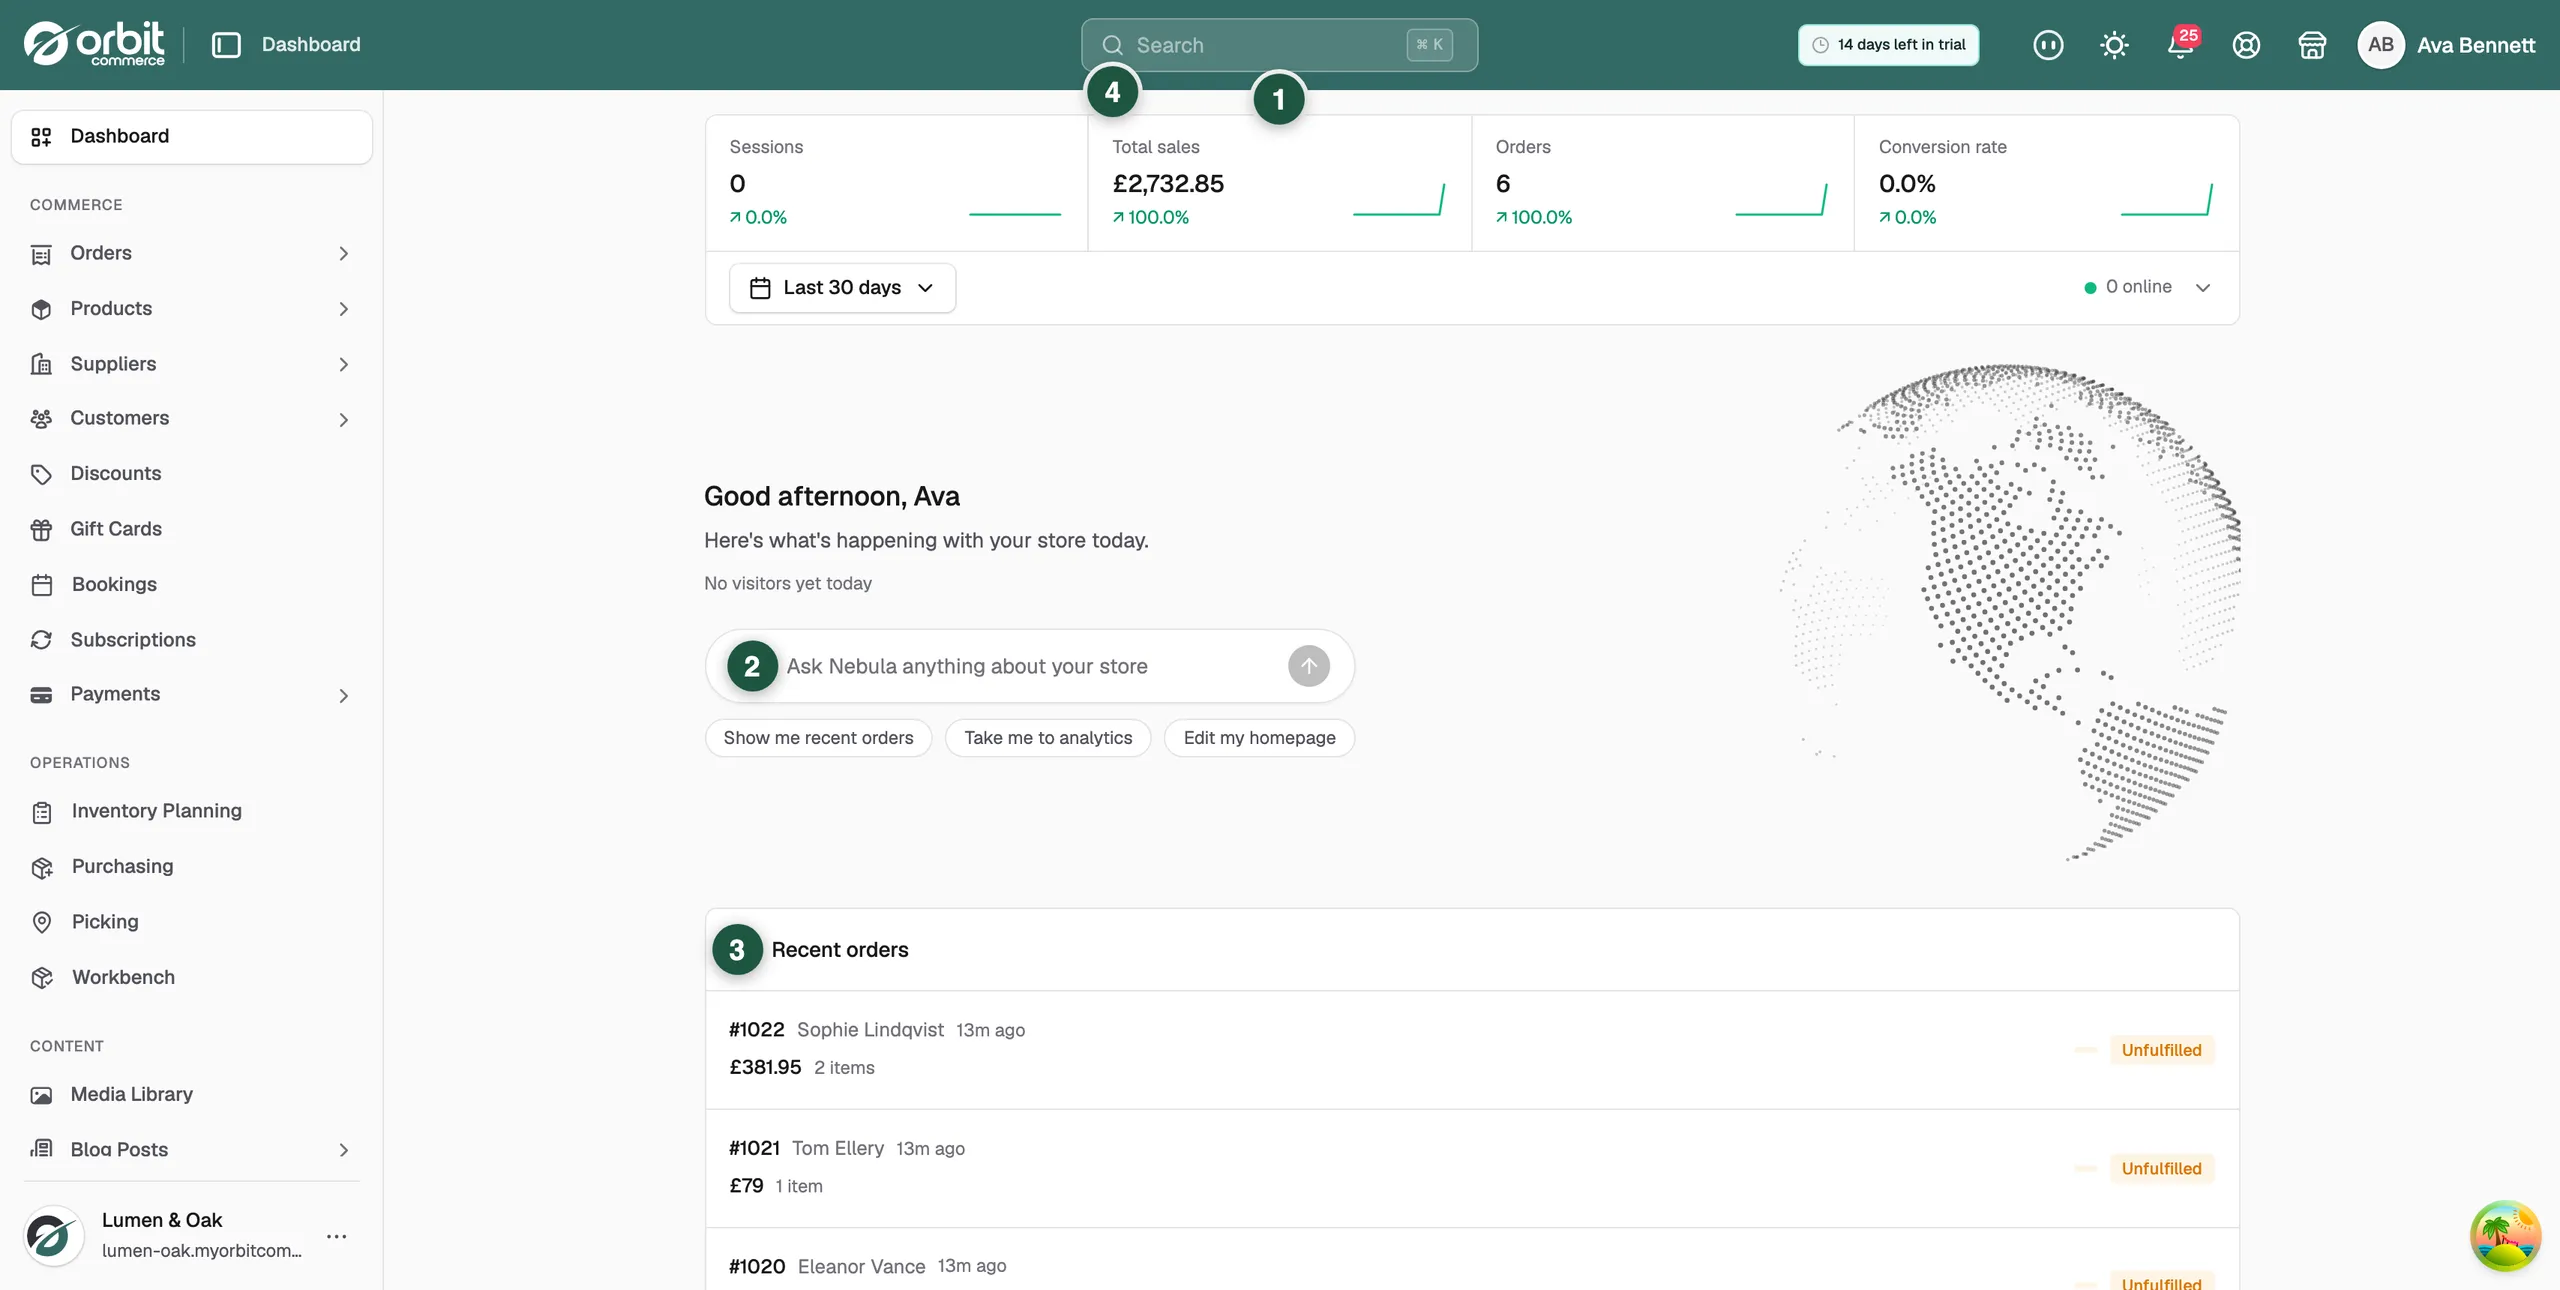
Your Orbit dashboard opens with a band of four metric cards at the top. They are the quickest read on how your store is doing. The definitions behind them are worth knowing, because two of them are counted in ways that surprise people.
What each card means
- Sessions: visits to your storefront in the period. One person visiting twice counts twice, which is how every analytics tool counts visits.
- Total sales: the value of paid orders placed in the period. Order totals include delivery and tax and are after discounts. Refunds are not taken off this figure.
- Orders: how many orders were placed in the period, including orders still waiting for payment. Draft, cancelled and refunded orders are left out.
- Conversion rate: orders divided by sessions, as a percentage. It is the single best measure of store health.
Read the change figure
Each card carries a small arrow and a percentage. That is the change against the same length of time before the period you are looking at. Green with an up arrow is a rise, red with a down arrow is a fall. Under it, a small chart shows the same figure day by day.
Note: A large percentage against a very small base is noise, not news. Read the absolute number beside it before you act.
Change the dates
- Click the date button under the cards. It reads Last 30 days until you change it.
- Pick Today, Yesterday, Last 7 days, Last 30 days, Last 90 days, Last 365 days or Custom.
- All four cards and their charts update to the dates you picked.
See more detail
- Click a card to open its chart in full.
- The chart labels the two lines Current and Previous.
- Click the arrow on the right of the band to close it again.
Beside that arrow, a green dot and a count show how many people are on your store at this moment. Click through to Using Live View for the full picture.
Things to watch for
- A new store with no traffic shows zeros and 0.0%. Nothing is broken.
- A campaign that has started pulls your conversion rate down at first, because curious visitors arrive before buyers do. Read it again in a week.
- Total sales is your top line, not the money that reaches your bank. Payouts are after fees and refunds.
Related guides
Was this helpful?
0 people found this helpful