Understanding demand forecasts
What velocity, days of stock, run-out dates and ABC grades mean on the Inventory Planning page, and how far to trust them.
The Inventory Planning table reads your sales history and turns it into an answer to one question: how long until this runs out? This guide explains what each forecast column means and how far to trust it. The page is under Operations > Inventory Planning, on the Enterprise plan.
Considerations
- The figures cover the last 28 days of orders.
- They are worked out across the whole store, not per location, because orders do not record a location. The same figure repeats on each location row for a variant.
- A forecast needs history. A product you launched last week has nothing to read yet.
- Nothing here changes your stock. The numbers only tell you when to buy.
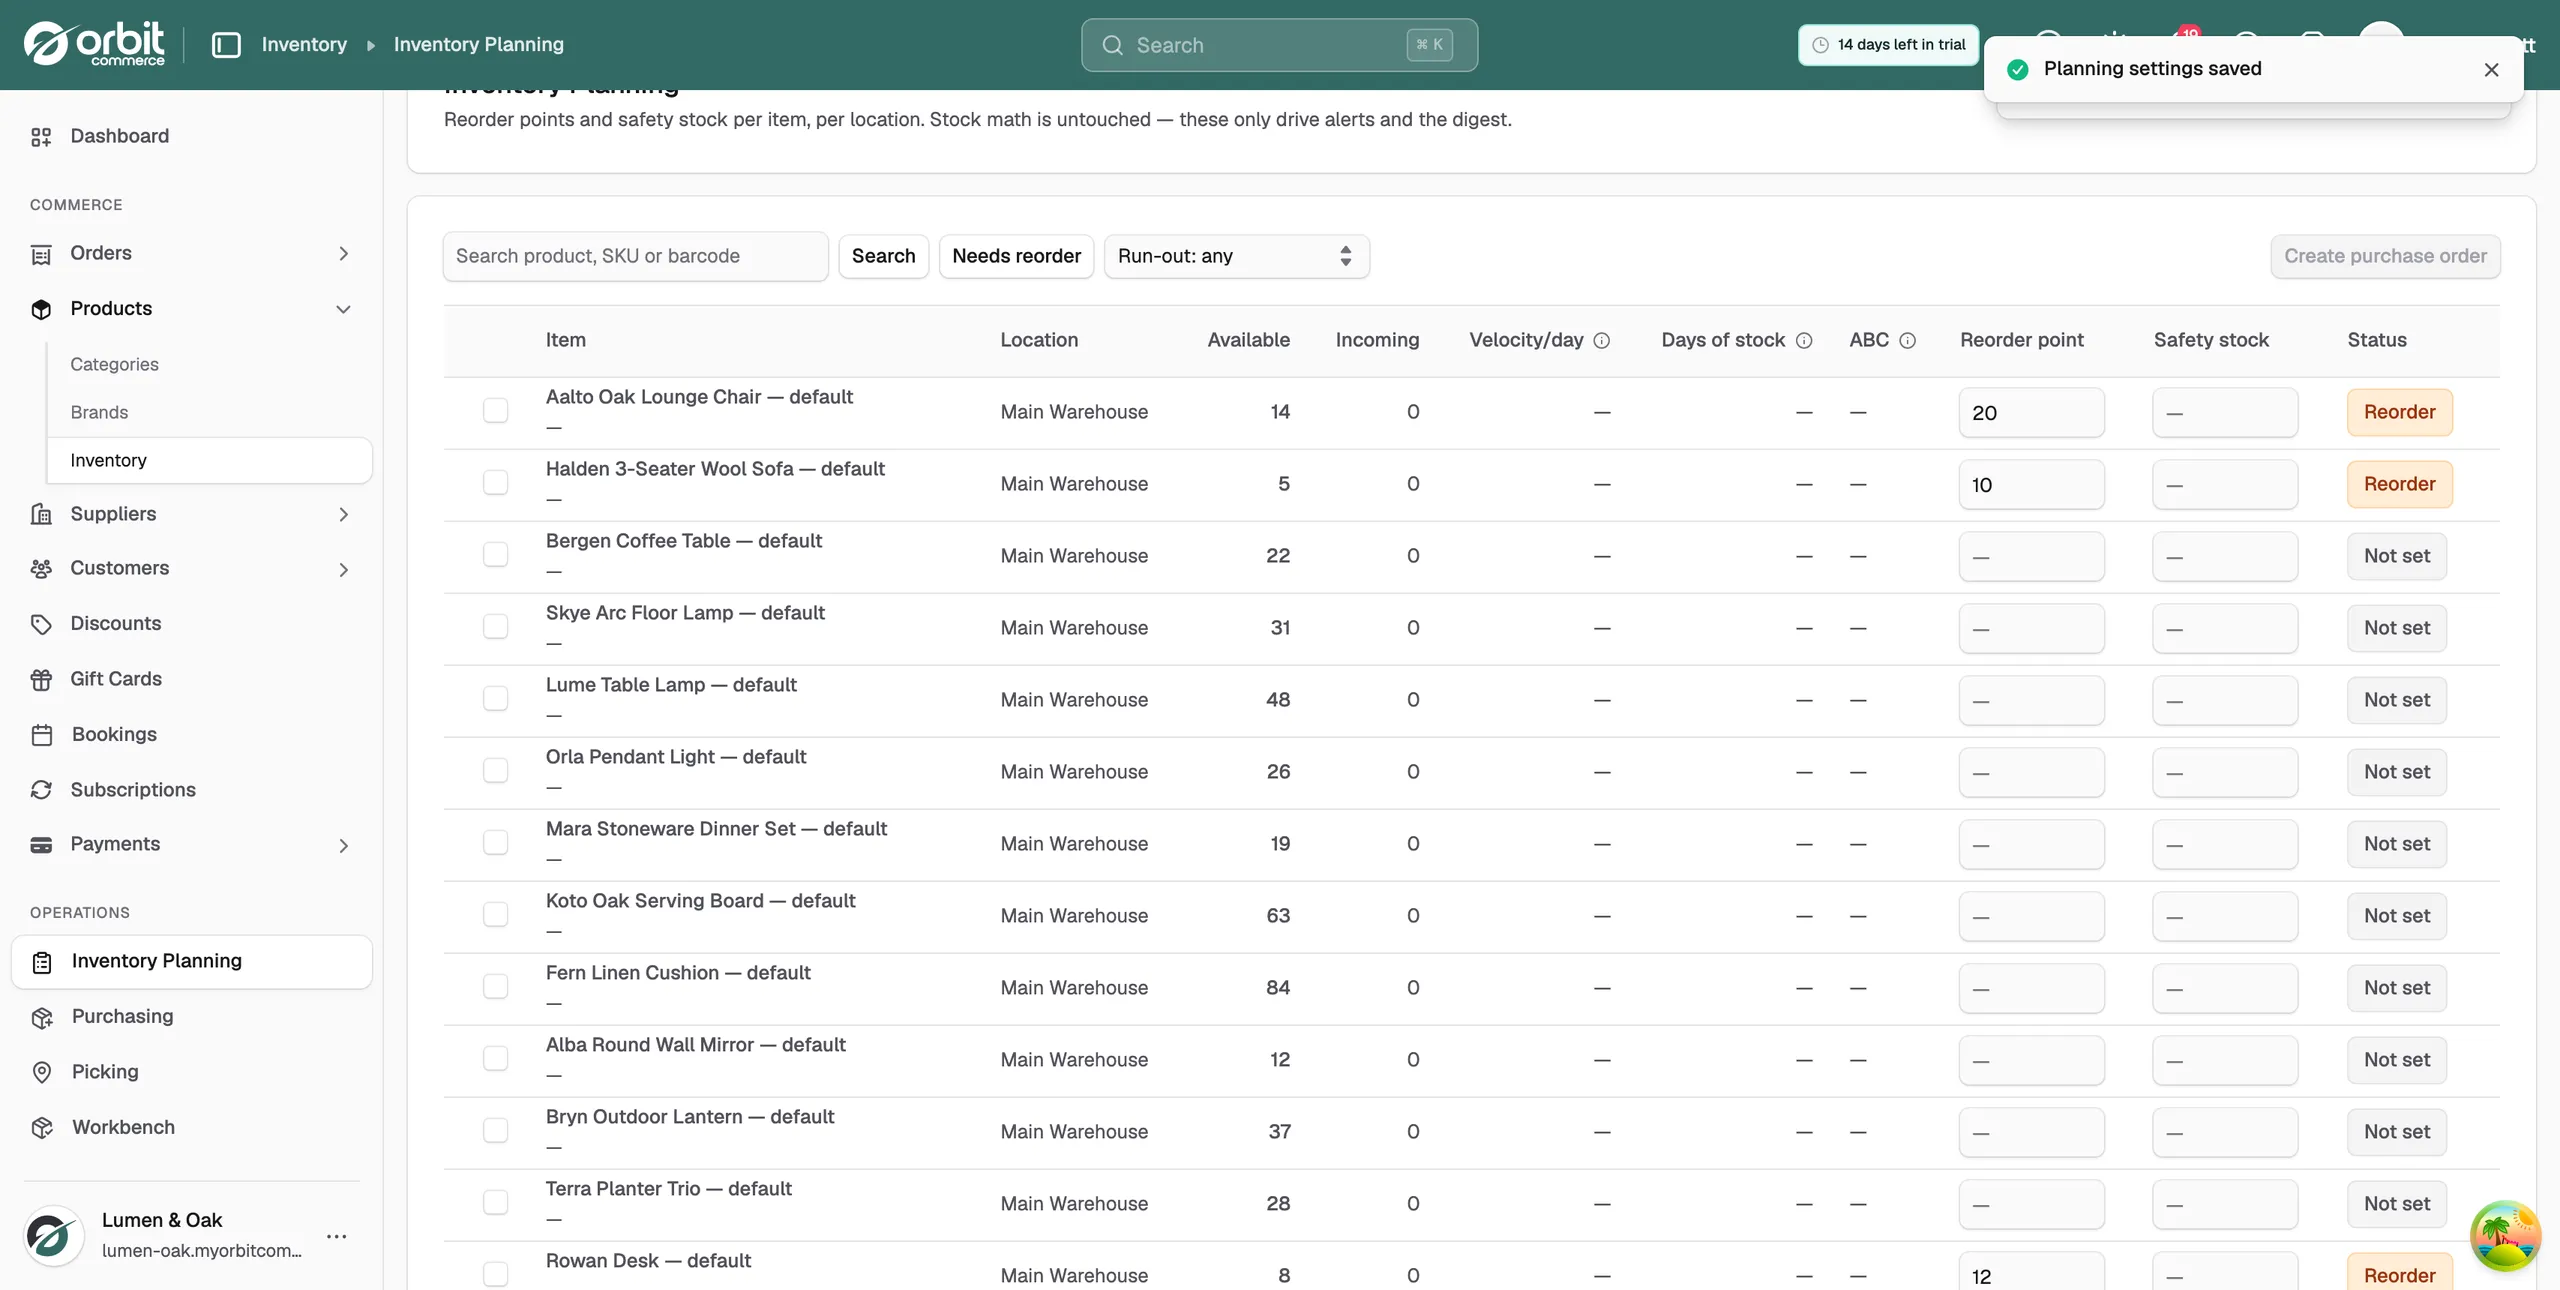
What the forecast columns mean
- Available: the stock you can sell right now at that location.
- Incoming: the stock your open purchase orders will deliver.
- Velocity/day: units ordered per day over the last 28 days. Days when the item was out of stock are left out, so a sell-out does not drag the rate down.
- Days of stock: available stock divided by velocity. The projected run-out date sits under it, as Runs out and a date. This is the column to watch.
- ABC: the item's share of your revenue over the same 28 days. A is the top 80 per cent, B the next 15, C the rest. It shows a dash until the store has 30 orders in the window.
Some rows carry extra labels. OOS and a number of days means the item was out of stock that often, so its velocity is based on fewer days. A purple waiting badge counts customers signed up for a back-in-stock alert.
Turn a forecast into an order
Compare days of stock against your supplier's lead time. When days of stock gets close to the lead time, it is time to buy. A reorder point makes Orbit do that comparison for you and flag the item Reorder.
- Go to Operations > Inventory Planning.
- Use the Run-out: any menu to show items that run out within 7, 14 or 30 days.
- Tick the items you want to buy, then click Create purchase order.
The steps for setting reorder points and filling in the order are in Setting reorder points and raising a purchase order.
When the numbers mislead
- New lines have no meaningful velocity. Give them a couple of weeks before you trust the figure.
- Seasonal peaks break a flat average. Raise safety stock ahead of a known peak rather than trusting the last 28 days.
- A one-off bulk order inflates velocity for a month. Read the run-out date next to it before you act.
- Velocity is store-wide, so a product that sells mostly from one shop still shows the same rate on every location row.
Related guides
Was this helpful?
0 people found this helpful